Report For Week Dated: 2/06/2015
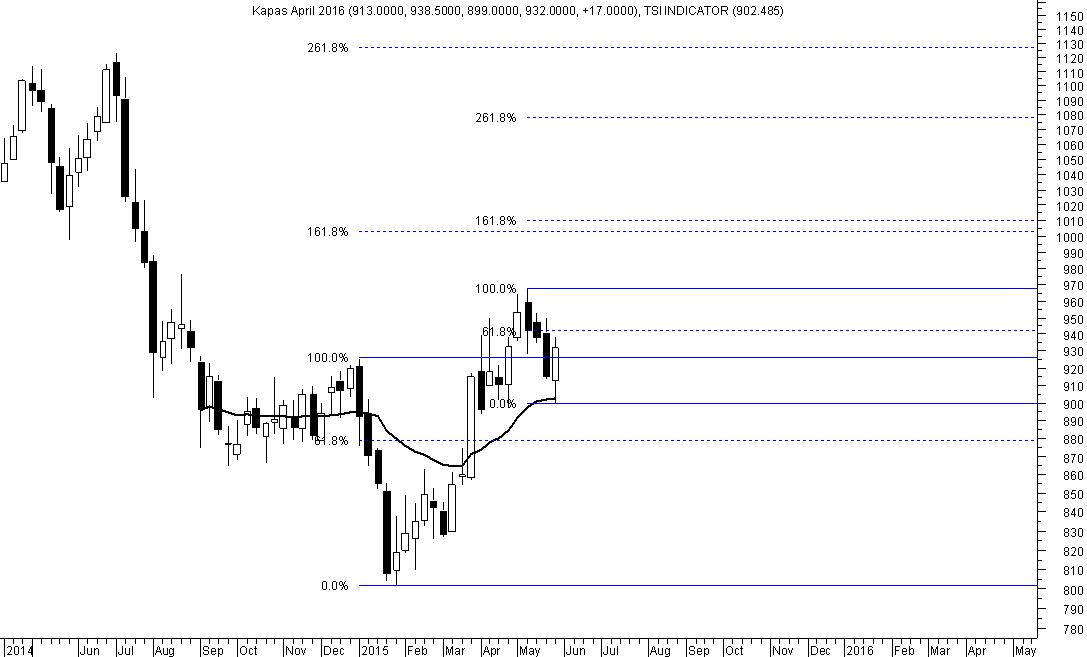
NCDEX Kapas April’16 (Price are in INR (Rs)/20 Kg)
Weaker opening and correction to 923-908 can be used for buying with a stop loss of 893.
Resistance is at 947 to 967.
In the event of a breakout and close above 967, expect a rally to 1002-1010 range.
Earlier, we had seen a breakout above 925 on the 2 year adjusted continuous chart of Kapas.
Correction appears to be complete.
If breakout above 967 is not witnessed then consolidation between 967 and 893 will be seen.
Overall must not fall and close below 893.
WEEKLY TREND INFORMATION WITH WEEKLY LEVELS
|
STRATEGY
|
CLOSE
|
DRV
|
TREND*
|
Trend Price
|
Trend
Date
|
L1
|
L2
|
CP
|
L3
|
L4
|
|
Hold Long
|
932.0
|
902.5
|
UP
|
915.0
|
27.03
|
868
|
908
|
923
|
947
|
987
|
*Trend will remain Down as long as last close is below the pink color DRV. Trend will be Up as long as Price is above DRV. Positional Traders: If trend is up then traders long can hold long position with weekly closing stop loss of DRV: Close >DRV. If trend is down then traders can hold short position with a weekly closing stop loss of DRV: Close <DRV.
PRICE, VOLUME AND OPEN INTEREST STRATEGY
|
Last Close
|
Price G/L%
|
Volume
|
% V Inc/Dec
|
Open Interest
|
% OI Inc/Deco
|
Candle
|
Position
|
|
932.0
|
1.9
|
6671.0
|
11.2
|
2400
|
-22.2
|
Positive
|
Unwinding
|
TECHNICAL INDICATORS TABLE
|
RSI
|
1-ROC-RSI
|
Stochastic
|
1-ROC-
Stochastic
|
MACD
|
1-ROC
MACD
|
RS
|
1-ROC
RS
|
|
56.16
|
6.21
|
44.23
|
-10.69
|
9.46
|
11.58
|
37.01
|
29.23
|
Disclaimer: There is risk of loss in trading in derivatives and the report is not to be construed as investment advice. The information provided in this report is intended solely for informative purposes. The author, directors and other employees of CC Commodity Info Services cannot be held responsible for the accuracy of the information presented herein or for the results of the positions taken based on the opinions expressed above.


