Report For Week Dated: 2/06/2015
MCX Cotton Bales Weekly (Price are in INR (Rs)/Bales)
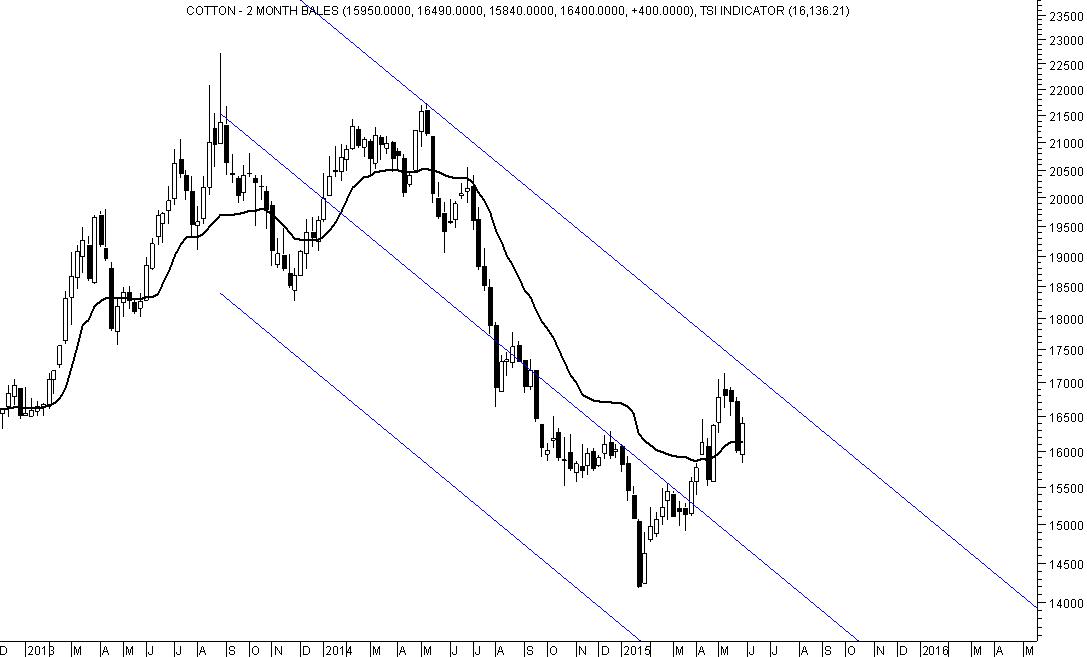
Further weakness will be seen below 15840.
Oscillation around the DRV can happen.
Resistance will be at 16647 to 17140.
Further rally can resume on breakout and close above 17140.
Traders long and holding the same can maintain the stop loss at 15840.
Addition of long position has been witnessed.
Indicators moved up which suggest that bias could be up for Cotton with intra-week volatility.
Higher range for the week can be 16647-17297.
WEEKLY TREND INFORMATION WITH WEEKLY LEVELS
|
STRATEGY
|
CLOSE
|
DRV
|
TREND*
|
Trend Price
|
Trend
Date
|
L1
|
L2
|
CP
|
L3
|
L4
|
|
Hold Long
|
16400.0
|
16136.2
|
UP
|
16400.0
|
29.05
|
15347
|
15997
|
16243
|
16647
|
17297
|
*Trend will remain Down as long as last close is below the pink color DRV. Trend will be Up as long as Price is above DRV. Positional Traders: If trend is up then traders long can hold long position with weekly closing stop loss of DRV: Close >DRV. If trend is down then traders can hold short position with a weekly closing stop loss of DRV: Close <DRV.
PRICE, VOLUME AND OPEN INTEREST STRATEGY
|
Last Close
|
Price G/L%
|
Volume
|
% V Inc/Dec
|
Open Interest
|
% O Inc/Dec
|
Candle
|
Strategy
|
|
16400.0
|
2.5
|
315090.0
|
153.3
|
6197
|
57.6
|
Positive
|
Addition Long
|
TECHNICAL INDICATORS TABLE
|
|
1-ROC-RSI
|
Stochastic
|
1-ROC-
Stochastic
|
MACD
|
1-ROC
MACD
|
RS
|
1-ROC
RS
|
|
56.47
|
16.43
|
58.57
|
-3.20
|
23.77
|
177.60
|
43.78
|
59.15
|
Disclaimer: There is risk of loss in trading in derivatives and the report is not to be construed as investment advice. The information provided in this report is intended solely for informative purposes. The author, directors and other employees of CC Commodity Info Services cannot be held responsible for the accuracy of the information presented herein or for the results of the positions taken based on the opinions expressed above.


