Report For Date: 21/02/2017
Technical: USD Is In Support Zone Against Indian Rupee
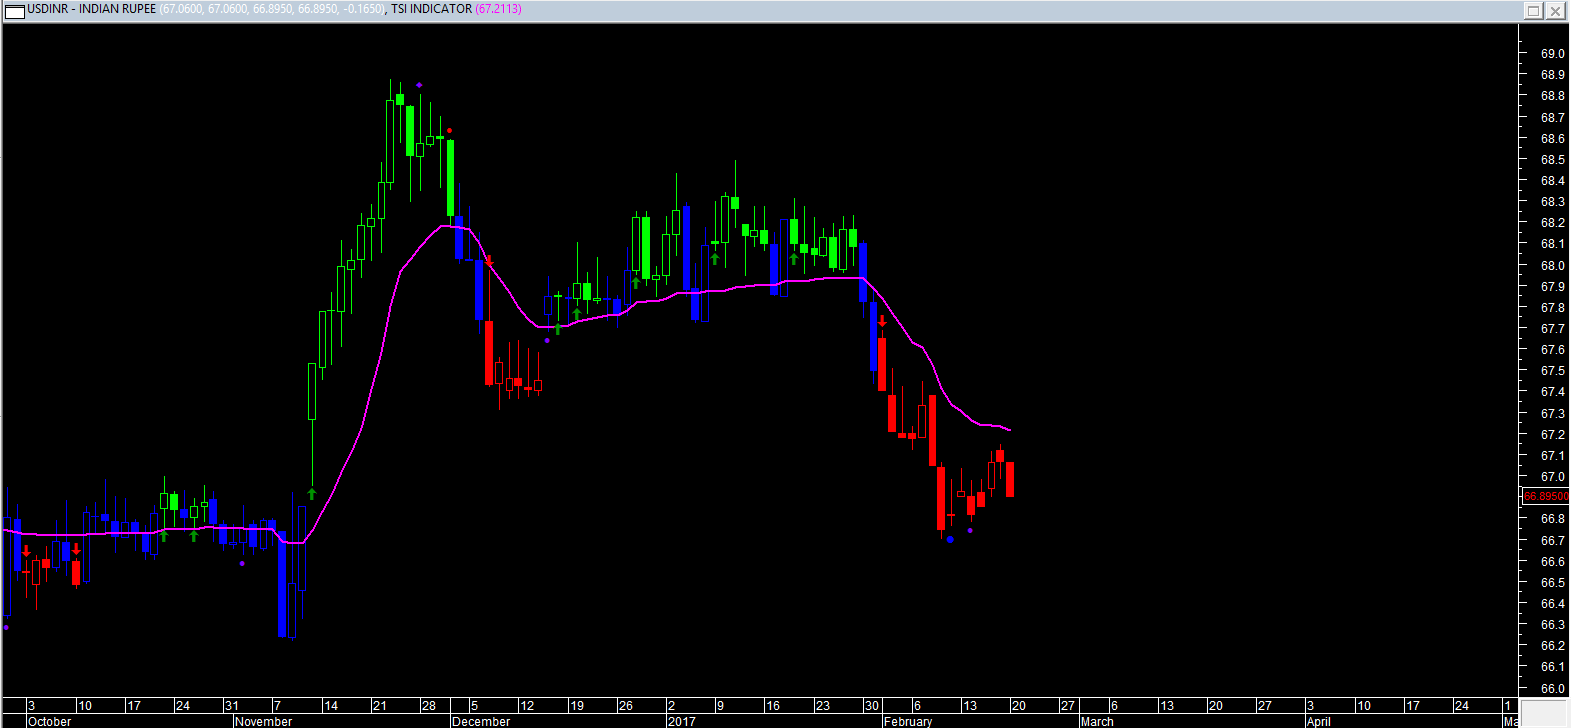
The USD prices against INR are in support zone now and may recover in coming sessions.
The prices closed inside the channel.
RSI and stochastic showing oversold zone and thus a recovery may be seen.
Support will be at 66.90 – 66.70 area while resistance will be at 67.20 – 67.40.
TREND INFORMATION WITH INTRA-DAY LEVELS
|
STRATEGY
|
CLOSE
|
DRV
|
TREND*
|
Trend
Price
|
Trend
Date
|
L1
|
L2
|
CP
|
L3
|
L4
|
|
Recovery May Be Seen
|
66.9
|
67.2
|
DOWN
|
67.8
|
30.01
|
66.7
|
66.8
|
67.0
|
67.0
|
67.2
|
*Trend will remain Down as long as last close is below the pink color DRV. Trend will be Up as long as Price is above DRV. Positional Traders: If trend is up then traders long can hold long position with closing stop loss of DRV: Close >DRV. If trend is down then traders can hold short position with a closing stop loss of DRV: Close <DRV.
TECHINCAL INDICATORS TABLE
|
RSI
|
1-ROC-RSI
|
Stochastic
|
1-ROC-
Stochastic
|
MACD
|
1-ROC
MACD
|
RS
|
1-ROC
RS
|
|
37.36
|
-8.61
|
63.76
|
-5.23
|
-0.25
|
1.34
|
64.02
|
5.43
|
Note: Red Color Bar= Down Trend, Green Color Bars= Up Trend, Blue Color Bars= Sideways(Trend could be up or down), Pink Color line= DRV, V marked= Increase in Volume in relation to last few days. Trend will remain Down as long as last close is below the pink color DRV. Trend will be Up as long as Price is above DRV. Blue Color dots above the price are profit booking alerts. Purple dot on the charts are swing top/bottoms could be in place.
Disclaimer: There is risk of loss in trading in derivatives and the report is not to be construed as investment advice. The information provided in this report is intended solely for informative purposes. The author, directors and other employees of CC Commodity Info Services cannot be held responsible for the accuracy of the information presented herein or for the results of the positions taken based on the opinions expressed above.


