Report For Week Dated: 20/04/2015
Nickel Weekly (Price figure in INR (Rs)/Per Kg)
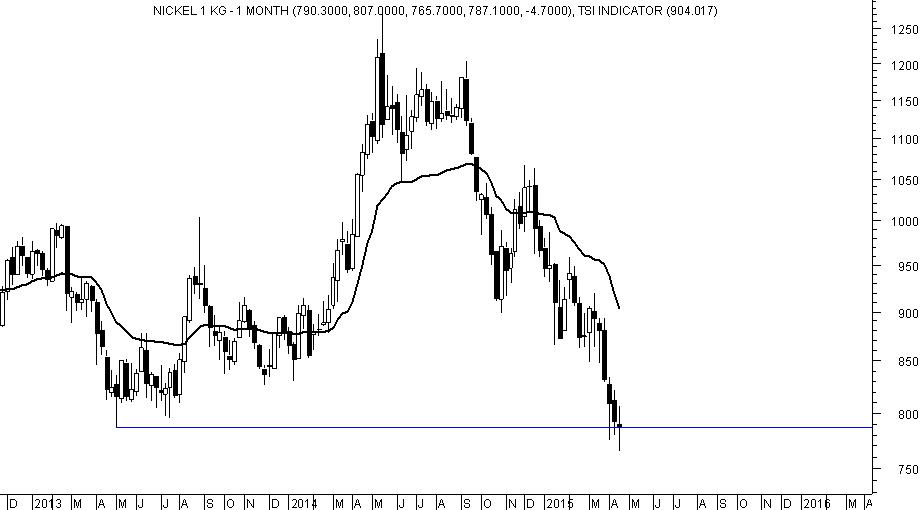
Traders short and holding the same can keep the stop loss at 810.
The earlier bottom was 787 and the low registered last week was 765.70.
The close was at 787.10.
A long legged doji was formed on the weekly chart which suggests that further downside movement will continue below 765.
WEEKLY TREND INFORMATION WITH WEEKLY LEVELS
|
STRATEGY
|
CLOSE
|
WRV
|
TREND*
|
Trend
Price
|
Trend
Date
|
L1
|
L2
|
CP
|
L3
|
L4
|
|
Hold Short
|
787.10
|
904.02
|
DOWN
|
990.8
|
19.12
|
725
|
766
|
787
|
807
|
849
|
*Trend will remain Down as long as last close is below the pink color DRV. Trend will be Up as long as Price is above DRV. Positional Traders: If trend is up then traders long can hold long position with weekly closing stop loss of DRV: Close >DRV. If trend is down then traders can hold short position with a weekly closing stop loss of DRV: Close <DRV.
PRICE, VOLUME AND OPEN INTEREST STRATEGY
|
Last Close
|
Price G/L%
|
Volume
|
% V Inc/Dec
|
Open Interest
|
% OI Inc/Dec
|
Candle
|
Position
|
|
787.10
|
-0.59
|
42299752
|
-3.87
|
25922.00
|
3.56
|
Indecisive
|
Addition long/Short
|
TECHNICAL INDICATORS TABLE
|
RSI
|
1-ROC-RSI
|
Stochastic
|
1-ROC-
Stochastic
|
MACD
|
1-ROC
MACD
|
RS
|
1-ROC
RS
|
|
30.66
|
-1.33
|
16.83
|
27.71
|
-51.17
|
-5.70
|
17.76
|
-8.19
|
Disclaimer: There is risk of loss in trading in derivatives and the report is not to be construed as investment advice. The information provided in this report is intended solely for informative purposes. The author, directors and other employees of CC Commodity Info Services cannot be held responsible for the accuracy of the information presented herein or for the results of the positions taken based on the opinions expressed above.


