Report for Date: 05/06/2017
MCX Gold (Price figures below are in Rs/INR per Kg)
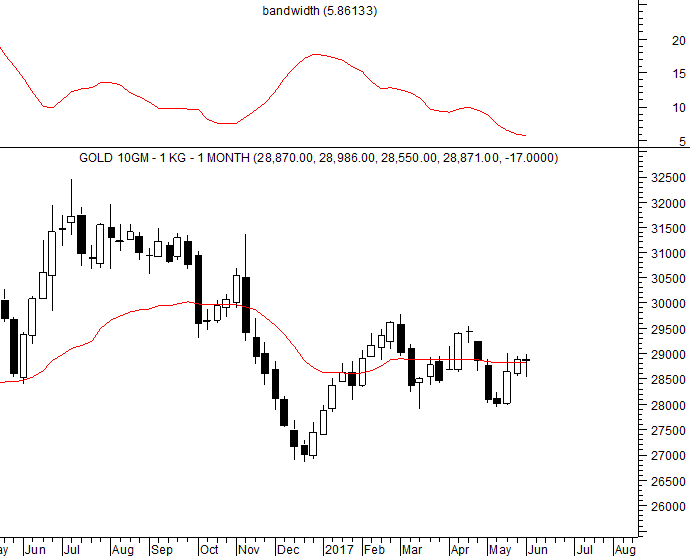
Traders long and holding the same can maintain the stop loss at 28564.
Expect higher range of 29055-29481 to be tested.
Weakness is below 28564.
Sideways movement and oscillation around DRV is being witnessed.
TREND INFORMATION WITH WEEKLY LEVELS
|
STRATEGY
|
CLOSE
|
DRV
|
TREND*
|
Trend
Price
|
Trend
Date
|
L1
|
L2
|
CP
|
L3
|
L4
|
|
Hold Long
|
28871.00
|
28832.46
|
UP
|
28888.0
|
26.05
|
28183
|
28619
|
28802
|
29055
|
29491
|
*Trend will remain Down as long as last close is below the pink color DRV. Trend will be Up as long as
Price is above DRV.
PRICE, VOLUME AND OPEN INTEREST STRATEGY
|
Last Close
|
Price G/L%
|
Volume
|
V -G/L%
|
Open Interest
|
OI -G/L %
|
Candle
|
Position
|
|
28871.0
|
-0.1
|
19955000
|
-53.4
|
55
|
-98.4
|
Indecisive
|
Unwinding
|
TECHINCAL INDICATORS TABLE
|
RSI
|
1-ROC-RSI
|
Stochastic
|
1-ROC-
Stochastic
|
MACD
|
1-ROC
MACD
|
RS
|
1-ROC
RS
|
|
50.43
|
-0.33
|
65.00
|
70.08
|
-99.64
|
18.51
|
82.12
|
7.02
|
Disclaimer: There is risk of loss in trading in derivatives and the report is not to be construed as investment advice. The information provided in this report is intended solely for informative purposes. The author, directors and other employees of CC Commodity Info Services cannot be held responsible for the accuracy of the information presented herein or for the results of the positions taken based on the opinions expressed above.


