Report For Date: 23/04/2018
NCDEX Guar Seeds (Price are in INR)
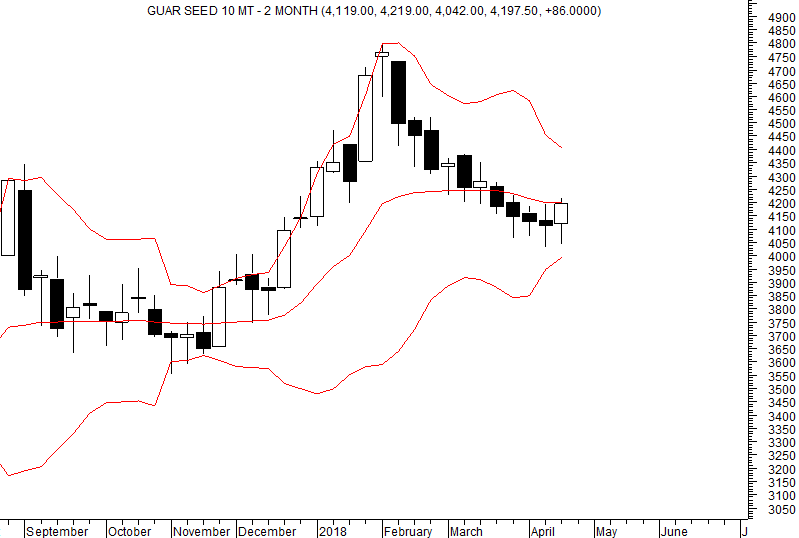
Cover short position at 4197 or below as the opportunity arises.
Expect higher range of 4264-4441.
Weakness will resume on fall and close below 4033.
Bollinger Lower Band is at 3993.
Bollinger Upper Band is at 4406.
Expect higher range and Bollinger Upper Band to be tested.
TREND INFORMATION WITH INTRA-DAY LEVELS
|
STRATEGY
|
CLOSE
|
DRV
|
TREND*
|
Trend
Price
|
Trend
Date
|
L1
|
L2
|
CP
|
L3
|
L4
|
|
-
|
4197.5
|
4200.3
|
DOWN
|
4183.5
|
23.03
|
3910
|
4087
|
4153
|
4264
|
4441
|
*Trend will remain Down as long as last close is below the pink color DRV. Trend will be Up as long as Price is above DRV. Positional Traders: If trend is up then traders long can hold long position with closing stop loss of DRV: Close >DRV. If trend is down then traders can hold short position with a closing stop loss of DRV: Close <DRV.
PRICE, VOLUME AND OPEN INTEREST STRATEGY
|
LAST CLOSE
|
PRICE G/L%
|
VOLUME
|
V -G/L%
|
OPEN INTEREST
|
OI -G/L %
|
CANDLE
|
POSITION
|
|
4197.5
|
2.1
|
270640
|
-28.2
|
123870
|
-3.0
|
Positive
|
Unwinding
|
TECHNICAL INDICATORS TABLE
|
RSI
|
1-ROC-RSI
|
STOCHASTIC
|
1-ROC
STOCHASTIC
|
MACD
|
1-ROC
MACD
|
RS
|
1-ROC
RS
|
|
52.25
|
7.32
|
34.88
|
49.72
|
65.14
|
-10.20
|
52.36
|
30.06
|
Note: Red Color Bar= Down Trend, Green Color Bars= Up Trend, Blue Color Bars= Sideways(Trend could be up or down), Pink Color line= DRV, V marked= Increase in Volume in relation to last few days. Trend will remain Down as long as last close is below the pink color DRV. Trend will be Up as long as Price is above DRV. Blue Color dots above the price are profit booking alerts. Purple dot on the charts are swing top/bottoms could be in place.
Disclaimer: There is risk of loss in trading in derivatives and the report is not to be construed as investment advice. The information provided in this report is intended solely for informative purposes. The author, directors and other employees of CC Commodity Info Services cannot be held responsible for the accuracy of the information presented herein or for the results of the positions taken based on the opinions expressed above.


