Report For Date: 23/04/2018
NCDEX Soya Bean: (Price Are INR (Rs)/Quintal)
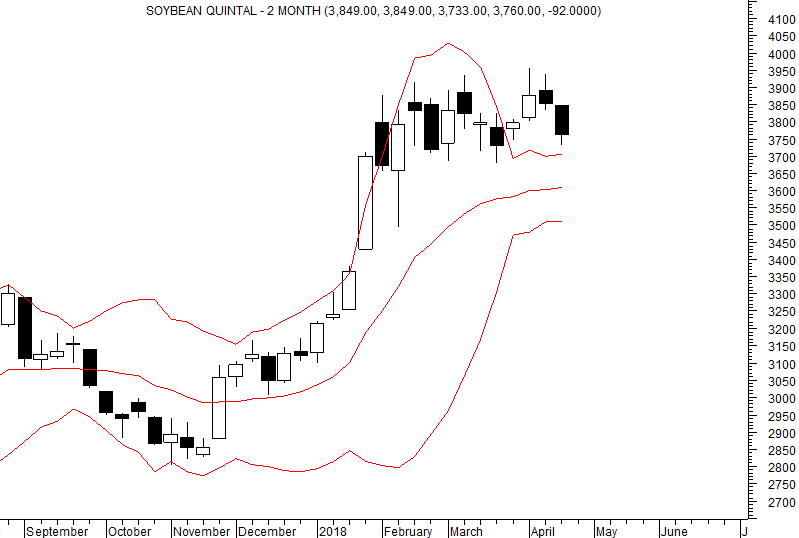
Traders by chance long and holding the same can maintain the stop loss at 3680.
Resistance will be at 3874-3915.
Bollinger Upper Band is at 3706.
DRV- is at 3852 and Bollinger Lower Band is at 3509.
If further breakout and close above 3955 is not witnessed then expect Bollinger Upper and to Bollinger Lower Band can be tested.
Higher range of 3914-3955 can be used to take profits and re-enter long if close is above 3955.
TREND INFORMATION WITH WEEKLY LEVEL
|
STRATEGY
|
CLOSE
|
DRV
|
TREND*
|
Trend
Price
|
Trend
Date
|
L1
|
L2
|
CP
|
L3
|
L4
|
|
-
|
3852.00
|
3605.31
|
UP
|
3058.0
|
24.11
|
3705.7
|
3810.7
|
3874.3
|
3915.7
|
4020.7
|
*Trend will remain Down as long as last close is below the pink color DRV. Trend will be Up as long as Price is above DRV. Positional Traders can hold long position with DRV as the closing stop loss and close > DRV. Traders can hold short position with DRV as the closing stop loss and close < DRV.
PRICE, VOLUME AND OPEN INTEREST STRATEGY
|
LAST CLOSE
|
PRICE G/L%
|
VOLUME
|
% V INC/DEC
|
OPEN INTEREST
|
% OI INC/DEC
|
CANDLE
|
POSITION
|
|
3852.0
|
-0.6
|
293290
|
-17.4
|
180130
|
32.0
|
Negative
|
Addition Short
|
TECHNICAL INDICATORS TABLE
|
RSI
|
1-ROC-RSI
|
STOCHASTIC
|
1-ROC
STOCHASTIC
|
MACD
|
1-ROC
MACD
|
RS
|
1-ROC
RS
|
|
68.89
|
-2.40
|
60.45
|
30.39
|
194.07
|
-1.12
|
80.91
|
0.75
|
Disclaimer: There is risk of loss in trading in derivatives and the report is not to be construed as investment advice. The information provided in this report is intended solely for informative purposes. The author, directors and other employees of CC Commodity Info Services cannot be held responsible for the accuracy of the information presented herein or for the results of the positions taken based on the opinions expressed above.


