Report For Date: 27/06/2017
NCDEX Kapas April 2018 in Rs/20Kg
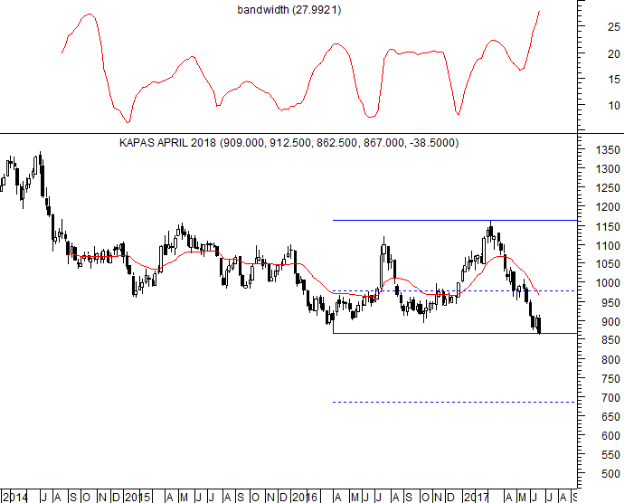
Traders short and holding the same can maintain the stop loss at 913.
Last bottom is at 866.
The same is being test as the low last week was 862.50 with bearish candle.
Addition of short position has been witnessed as open interest increased with the fall and negative candle.
Bandwidth is increasing therefore directional momentum is being witnessed on downside.
Another sustained fall and close below 862 with bearish candle can extend the slide.
Since the bottom of 862 is being tested recovery from lower level or from current level cannot be ruled out.
Lower range for the week can be at 849-798.
Resistance will be at 880-898-913.
Exit long and sell on rise to 880-898 with a stop loss of 913.
Pullback reversal rise can be seen on rise and close above 913.
TREND INFORMATION WITH WEEKLY LEVELS
|
STRATEGY
|
CLOSE
|
DRV
|
TREND*
|
Trend
Price
|
Trend
Date
|
L1
|
L2
|
CP
|
L3
|
L4
|
|
Hold Short
|
867.00
|
966.32
|
DOWN
|
1035.50
|
7.04
|
798.8
|
848.8
|
880.7
|
898.8
|
948.8
|
*Trend will remain Down as long as last close is below the pink color DRV. Trend will be Up as long as Price is above DRV. Positional Traders: If trend is up then traders long can hold long position with closing stop loss of DRV: Close >DRV. If trend is down then traders can hold short position with a closing stop loss of DRV: Close <DRV.
PRICE, VOLUME AND OPEN INTEREST STRATEGY
|
Last Close
|
Price G/L%
|
Volume
|
% V Inc/Dec
|
Open Interest
|
% OI Inc/Dec
|
Candle
|
Position
|
|
867.0
|
-4.3
|
20587
|
-4.8
|
8311
|
4.5
|
Negative
|
Addition Short
|
TECHNICAL INDICATORS TABLE
|
RSI
|
1-ROC-RSI
|
STOCHASTIC
|
1-ROC-
STOCHASTIC
|
MACD
|
1-ROC
MACD
|
RS
|
1-ROC
RS
|
|
30.66
|
-11.73
|
10.86
|
-0.53
|
-31.09
|
-22.22
|
24.68
|
-14.92
|
Disclaimer: There is risk of loss in trading in derivatives and the report is not to be construed as investment advice. The information provided in this report is intended solely for informative purposes. The author, directors and other employees of CC Commodity Info Services cannot be held responsible for the accuracy of the information presented herein or for the results of the positions taken based on the opinions expressed above.


