Report For Date: 12/06/2017
MCX Cotton Bales: (Price in Rs/Per Bale)
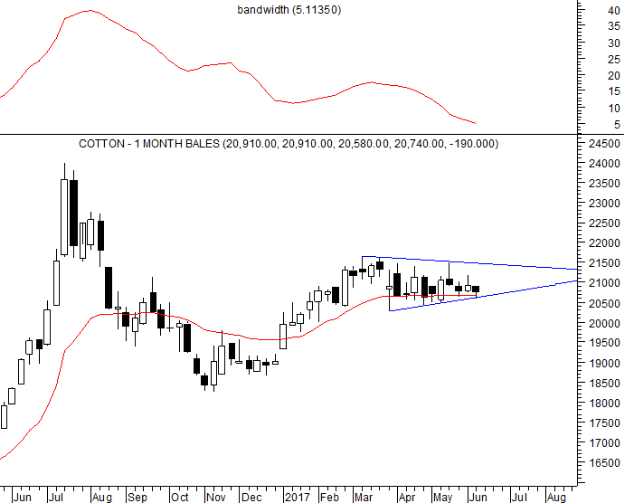
Sideways movement is being witnessed.
Bandwidth is falling suggesting contraction of movement.
DRV is flat and horizontal as can be seen in the chart.
Flat DRV indicates sideways movement and oscillation around the DRV.
Directional movement not being witnessed which indicates that any positional trade long or short may not yield substantial desired result.
The band of movement is 21650-20290.
Narrower band is 20290 to 21500.
Congestion band is 21190 to 20480.
Exit long on rise to resistance of 20907 or above as the opportunity arises.
Exit short on dip to 20577 or below.
The DRV is around 20600 since March 2017 on the weekly chart, so we have 11 weeks of sideways movement till now.
Traders need to wait for next decisive movement to get the directional trade working for them.
TREND INFORMATION WEEKLY LEVELS
|
STRATEGY
|
CLOSE
|
DRV
|
TREND*
|
Trend
Price
|
Trend
Date
|
L1
|
L2
|
CP
|
L3
|
L4
|
|
Hold Long
|
20740.00
|
20686.10
|
UP
|
55.5
|
4749.00
|
20247
|
20577
|
20743
|
20907
|
21237
|
*Trend will remain Down as long as last close is below the pink color DRV. Trend will be Up as long as Price is above DRV. Positional Traders: If trend is up then traders long can hold long position with closing stop loss of DRV: Close >DRV. If trend is down then traders can hold short position with a closing stop loss of DRV: Close <DRV.
PRICE, VOLUME AND OPEN INTEREST STRATEGY
|
Close
|
PRICE G/L%
|
VOLUME
|
% V INC/DEC
|
OPEN INTEREST
|
% OI INC/DEC
|
CANDLE
|
POSITION
|
|
20740.0
|
-0.9
|
184760
|
55.5
|
4749
|
-10.5
|
Negative
|
Unwinding
|
TECHNICAL INDICATORS TABLE
|
RSI
|
1-ROC-RSI
|
STOCHASTIC
|
1-ROC-
STOCHASTIC
|
MACD
|
1-ROC
MACD
|
RS
|
1-ROC
RS
|
|
52.60
|
-5.09
|
33.44
|
-18.08
|
230.84
|
-10.21
|
70.45
|
-13.21
|
Disclaimer: There is risk of loss in trading in derivatives and the report is not to be construed as investment advice. The information provided in this report is intended solely for informative purposes. The author, directors and other employees of CC Commodity Info Services cannot be held responsible for the accuracy of the information presented herein or for the results of the positions taken based on the opinions expressed above.


