
|
Green gram (Mung) |
||||||||||||||||||||||||||||||||||||||||||
| 05 October 2015 05:34 PM | ||||||||||||||||||||||||||||||||||||||||||
|
Green gram is an important pulses crop in India and believed to be originated from India. It is short duration legume crop grown mostly as a fallow crop in rotation with rice. Similar to the leguminous pulses, green gram, enriches soil nitrogen content. It is grown mostly in Asian region traditionally while its cultivation has spread to Africa and Americas relatively in the recent times. More than 70%t of world’s green gram production comes from India.
Green gram is scientifically known as Vigna radiata and it is commonly known as Mung in India. The plant grows as a small shrub with twining upper branches.
Economic Importance:
Mung, similar to other pulses, is grown primarily for its protein rich seeds. Mung contains 20-25% protein. The plants are sometimes cut and ploughed into the soil to enrich soil nitrogen.
Seasons and cultivation
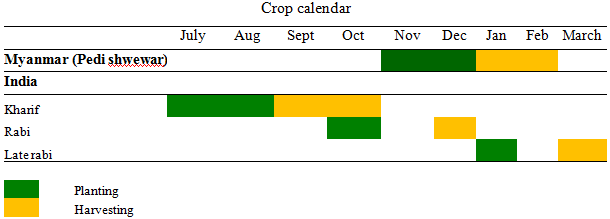
Green gram is a warm weather crop and comes up in areas receiving an annual rainfall ranging from 50 to 70 cm. It is mainly cultivated in a cereal-pulse cropping system primarily to conserve soil nutrients and utilize the left over soil moisture particularly, after rice cultivation. Hence, although it can be grown in all the seasons, majority of green gram cultivation falls in either Rabi or late Rabi seasons particularly in peninsular India.
Optimum temperature range for growth is 27-30oC. A dry harvest period is desirable as this forces the crop to mature and reduces the risk of weather damage. Green gram is less tolerant to water logging.
 Domestic Scenario
India is the world’s largest producer as well as consumer of green gram. It produces about 1.5 to 2.0 million tons of Mung annually from about 3 to 4 million hectares of area, with an average productivity of 500kg per hectare. Green gram output accounts for about 10-12% of total pulse production in the country.
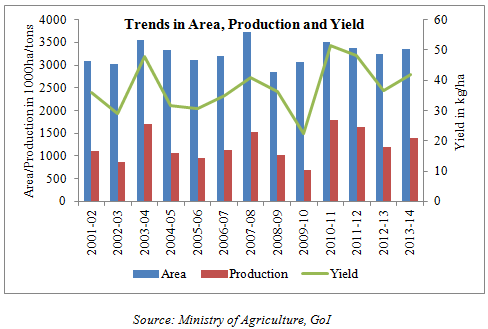 Mung production in the country remained stable more than a decade through the 2000s at around 10 to 15 lakh tons. But a sudden jump in output was noted in 2010-11 to 17.5 lakh tonnes primarily on account of rise in production from Madhya Pradesh, Rajasthan and Tamil Nadu.
Table 1: Trends in Trade and Supply (million tonnes)
Source: Ministry of Agriculture, GoI, IGPA and Trade Sources
State-wise Production
Mung production in the country is largely concentrated in five states viz, Rajasthan, Maharashtra, Andhra Pradesh, Gujarat and Bihar. These five states together contribute for about 70% of total Mung production in the country.
There is a distinct change in production pattern of Mung across states. Traditionally Rajasthan, Maharashtra, Andhra Pradesh are major Mung producing states. But there is significant rise in production from other states in recent years particularly, from Tamil Nadu, Uttar Pradesh and Gujarat. Nevertheless, production remained volatile across the years with respect to most of the states.
As per the latest available estimates, Rajasthan, Maharashtra occupies the first two positions, contributing over 45%. Andhra Pradesh contributes about 10% while together Gujarat and Bihar account for about 13% of total production in the country.  Source: GoI, Department of Agriculture & Cooperation (2014-15)
Major markets
Spot markets
Central India: Mumbai, Jalna, Latur, Akola, Indore, Pipariya, Harda
Northern India: Delhi, Kanpur, Lalitpur, Jhansi
Southern India: Tandur, Gulbarga, Yadgir, Bidar, Raichur, Sedam, Chennai
Futures markets:
Futures’ trading in mung was suspended in 2007.
External Trade
India is a net importer of mung. Imports are mainly sourced from Myanmar to meet the domestic demand. These imports have been hovering around 0.5 to 1.5 lakh tonnes during the past few years.
Major export destinations: NA
Major import sources: Myanmar
Factors influencing prices
o Changes in minimum support prices (MSP)
o Direct procurement by the government agencies and storage in warehouses
o Restriction on stock holding limits of the commodity
o Change in tariffs and
o Ban or changes in external trade policies with respect to the commodity.
|