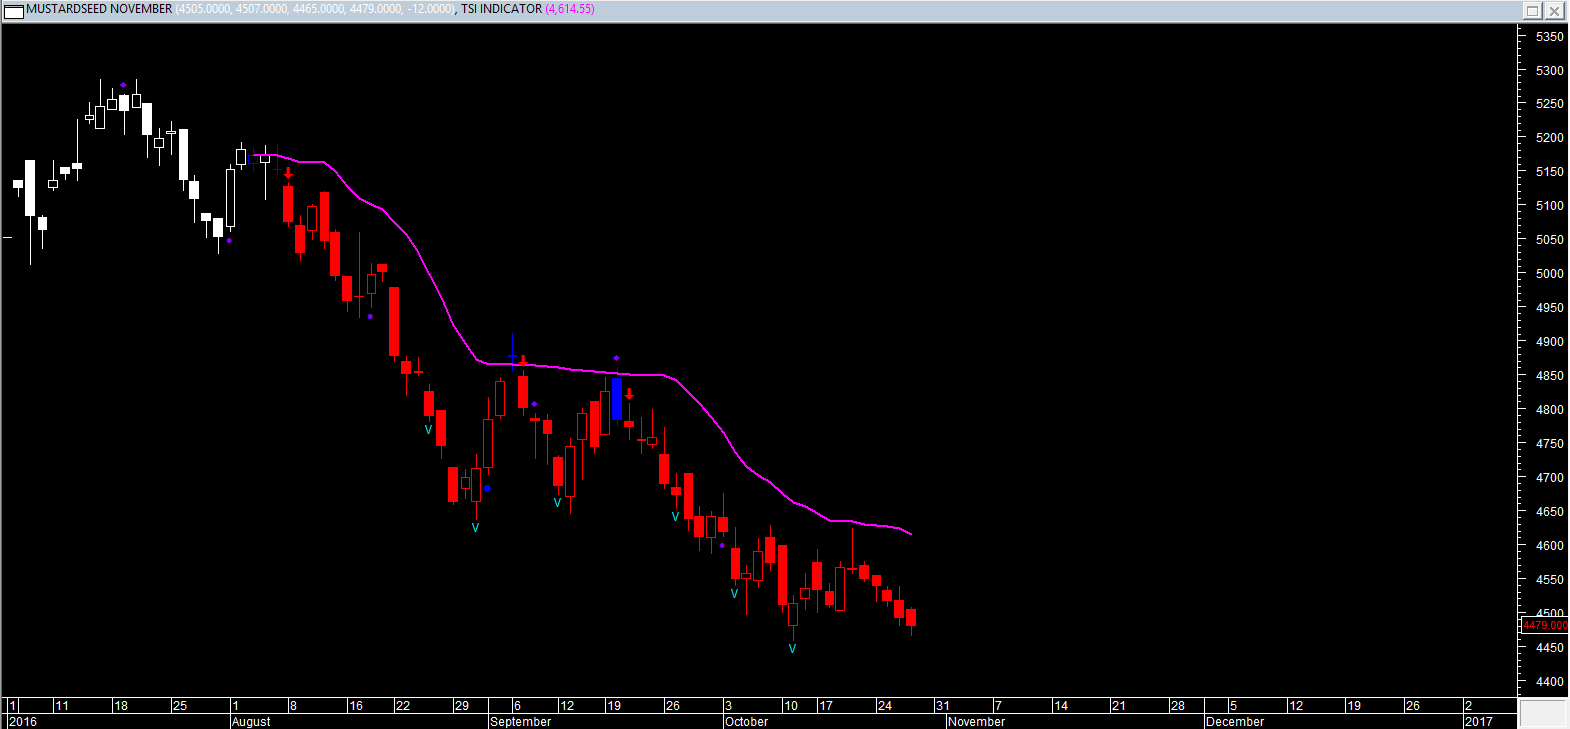
*Trend will remain Down as long as last close is below the pink color DRV. Trend will be Up as long as Price is above DRV. Positional Traders can hold long position with DRV as the closing stop loss and close > DRV. Traders can hold short position with DRV as the closing stop loss and close < DRV.
PRICE, VOLUME AND OPEN INTEREST STRATEGY
LAST CLOSE
PRICEG/L%
VOLUME
% V INC/DEC
OPENINTEREST
% OI INC/DEC
CANDLE
POSITION
4479.0
-0.3
31590
-13.9
38000
-4.9
Negative
Unwinding
TECHNICAL INDICATORS TABLE
RSI
1-ROC-RSI
STOCHASTIC
1-ROC-STOCHASTIC
MACD
1-ROCMACD
RS
1-ROCRS
32.65
-3.19
10.40
-33.09
-59.10
-1.04
16.63
-17.96
Note: Red Color Bar= Down Trend, Green Color Bars= Up Trend, Blue Color Bars= Sideways(Trend could be up or down), Pink Color line= DRV, V marked= Increase in Volume in relation to last few days. Trend will remain Down as long as last close is below the pink color DRV. Trend will be Up as long as Price is above DRV. Blue Color dots above the price are profit booking alerts. Purple dot on the charts are swing top/bottoms could be in place.
Disclaimer: There is risk of loss in trading in derivatives and the report is not to be construed as investment advice. The information provided in this report is intended solely for informative purposes. The author, directors and other employees of CC Commodity Info Services cannot be held responsible for the accuracy of the information presented herein or for the results of the positions taken based on the opinions expressed above.
Note : This forum is moderated. We reserve the right to not publish and/or edit the comment on the site, if the comment is offensive, contains inappropriate data or violates our editorial policy.