Report for Date: 26/10/2016
MCX Crude Oil November: Further Rise Is Above 3491 Closing
MCX Crude Oil (Price figures below are in Rs/INR per Kg)
Hold long position with a stop loss of 3331.
Expect a rise towards 3400 – 3440 levels.
Higher range can be used to take profits.
Further rise is above 3491 closing.
TREND INFORMATION WITH INTRA-DAY LEVELS
|
STRATEGY
|
CLOSE
|
DRV
|
TREND*
|
Trend
Price
|
Trend
Date
|
L1
|
L2
|
CP
|
L3
|
L4
|
|
Hold Long
|
3354.0
|
3317.2
|
UP
|
3256.0
|
29.09
|
3244.0
|
3322.0
|
3368.0
|
3400.0
|
3478.0
|
*Trend will remain Down as long as last close is below the pink color DRV. Trend will be Up as long as Price is above DRV is lower.
PRICE, VOLUME AND OPEN INTEREST STRATEGY
|
Last Close
|
Price G/L%
|
Volume
|
V -G/L%
|
Open Interest
|
OI -G/L %
|
Candle
|
Position
|
|
3354.0
|
0.0
|
14938000
|
4.1
|
12974
|
1.6
|
Indecisive
|
Addition long/Short
|
TECHINCAL INDICATORS TABLE
|
RSI
|
1-ROC-RSI
|
Stochastic
|
1-ROC-
Stochastic
|
MACD
|
1-ROC
MACD
|
RS
|
1-ROC
RS
|
|
53.05
|
-0.16
|
20.96
|
-24.58
|
49.13
|
-10.41
|
41.69
|
-2.29
|
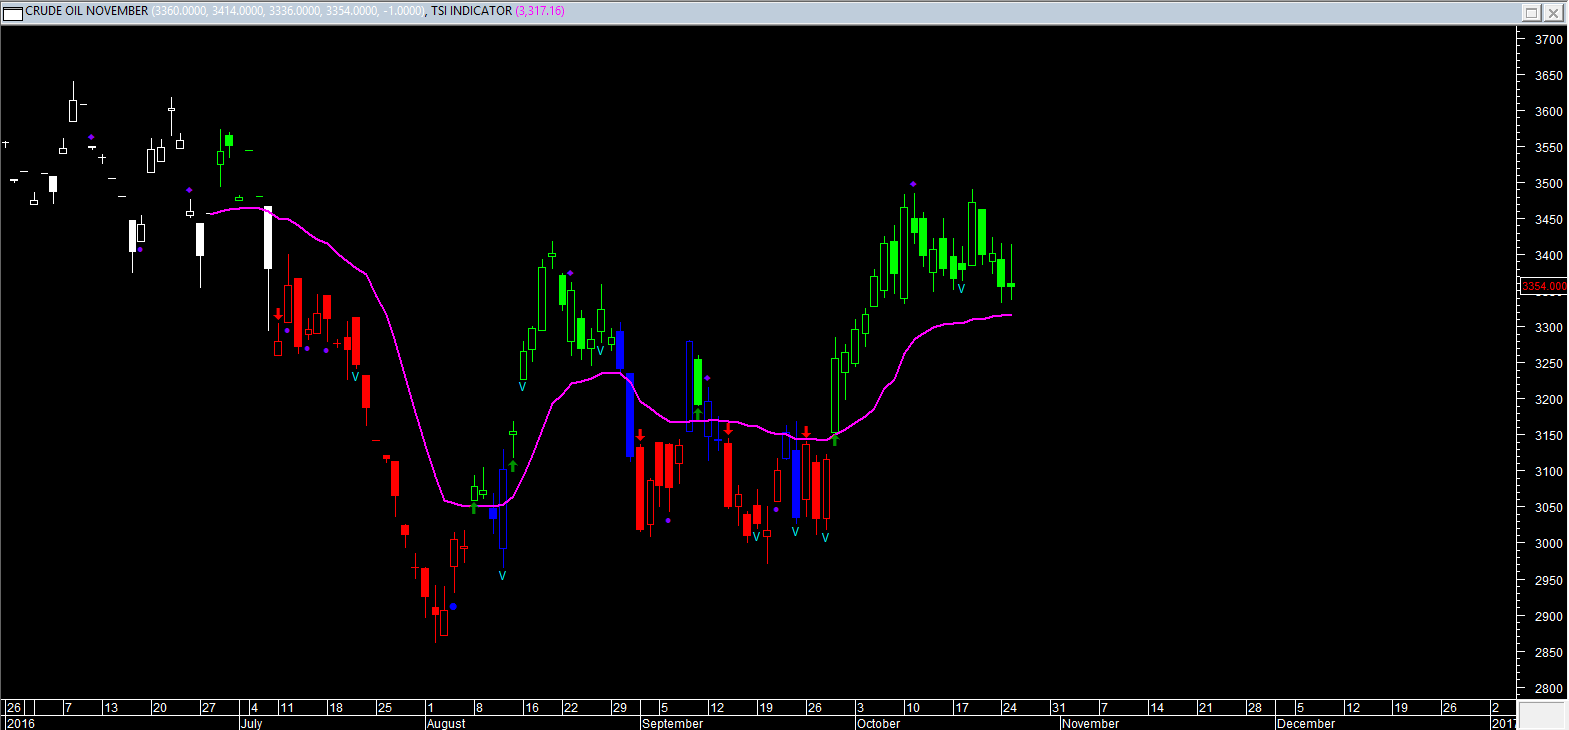
Note: Red Color Bar= Down Trend, Green Color Bars= Up Trend, Blue Color Bars= Sideways(Trend could be up or down), Pink Color line= DRV, V marked= Increase in Volume in relation to last few days. Trend will remain Down as long as last close is below the pink color DRV. Trend will be Up as long as Price is above DRV. Blue Color dots above the price are profit booking alerts. Purple dot on the charts are swing top/bottoms could be in place.
Disclaimer: There is risk of loss in trading in derivatives and the report is not to be construed as investment advice. The information provided in this report is intended solely for informative purposes. The author, directors and other employees of CC Commodity Info Services cannot be held responsible for the accuracy of the information presented herein or for the results of the positions taken based on the opinions expressed above.
View Full Image
|


