Report For Week Dated: 25/05/2015
MCX Aluminum Weekly: (Price in INR(Rs)/kg)
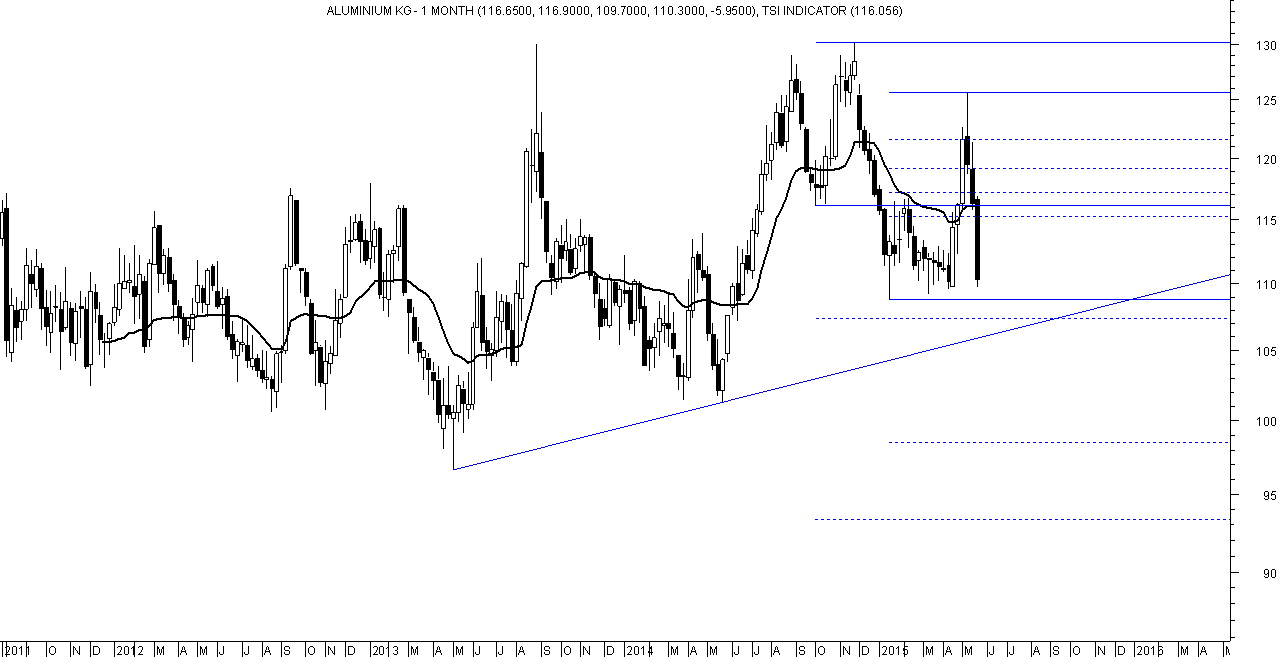
Exit long and sell on rise from 110-112.3-114.9 with a stop loss of 117.
Expect lower range of 107.7-100.50.
Historically, we can see 124-130 Aluminum is not able to cross and similarly, 100-95 is the lower side of the band which it does not break. This has been the order since the year 2010.
A fall down to 100-96 zone is for accumulation with a stop loss of 95.
Aluminum is likely to test the lower side of the long term band to be tested in near term to short term.
Lower range will attract support.
WEEKLY TREND INFORMATION WITH WEEKLY LEVELS
|
STRATEGY
|
CLOSE
|
DRV
|
TREND*
|
Trend
Price
|
Trend
Date
|
L1
|
L2
|
CP
|
L3
|
L4
|
|
Hold Short
|
110.3
|
116.1
|
DOWN
|
110.3
|
22.05
|
100.5
|
107.7
|
112.3
|
114.9
|
122.1
|
*Trend will remain Down as long as last close is below the pink color DRV. Trend will be Up as long as Price is above DRV. Positional Traders: If trend is up then traders long can hold long position with weekly closing stop loss of DRV: Close >DRV. If trend is down then traders can hold short position with a weekly closing stop loss of DRV: Close <DRV.
PRICE, VOLUME AND OPEN INTEREST STRATEGY
|
Last Close
|
Price G/L%
|
Volume
|
% V Inc/Dec
|
Open Interest
|
% OI Inc/Dec
|
Candle
|
Position
|
|
110.3
|
-5.1
|
183935008.0
|
-2.2
|
4972.0
|
58.0
|
Negative
|
Addition Short
|
TECHINCAL INDICATORS TABLE
|
RSI
|
1-ROC-RSI
|
Stochastic
|
1-ROC-
Stochastic
|
MACD
|
1-ROC
MACD
|
RS
|
1-ROC
RS
|
|
41.62
|
-18.60
|
35.53
|
-43.88
|
-0.51
|
-288.86
|
23.96
|
-25.11
|
Disclaimer: There is risk of loss in trading in derivatives and the report is not to be construed as investment advice. The information provided in this report is intended solely for informative purposes. The author, directors and other employees of CC Commodity Info Services cannot be held responsible for the accuracy of the information presented herein or for the results of the positions taken based on the opinions expressed above.


