Report For Week Dated: 30/03/2015
MCX Aluminum Weekly C2: (Price in INR(Rs)/kg)
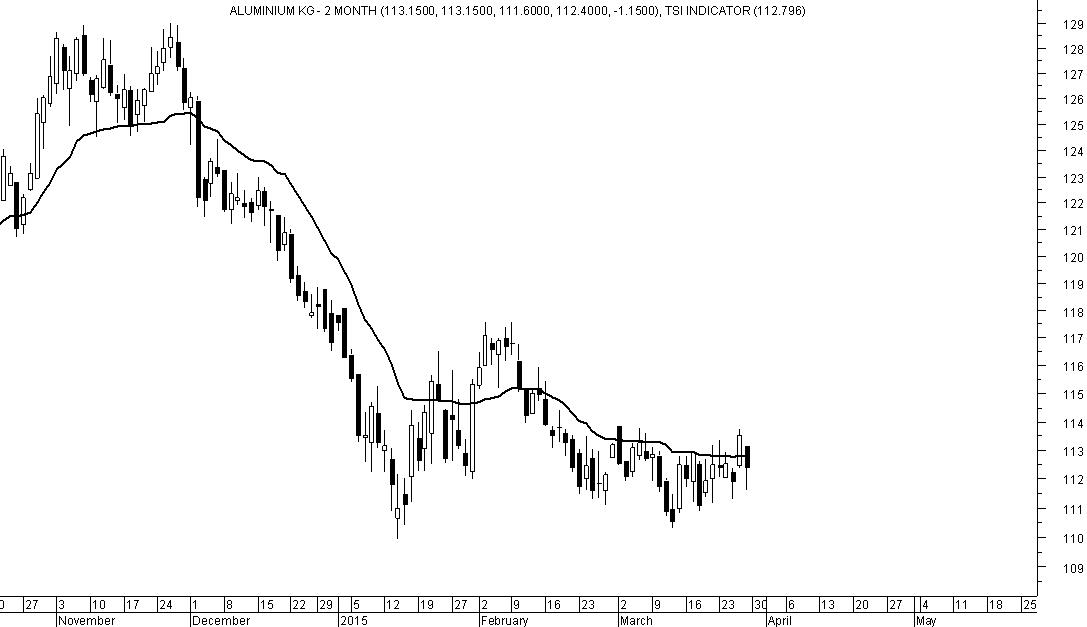
Traders short by chance need to maintain the stop loss at 114.
Sideways movement and oscillation around the DRV on weekly chart is being witnessed.
Breakout and close above 114 can lead to a rally.
The band of movement is 114 to 109.
Buy on breakout and close above 114 with low of the week as the stop loss or 112.4 whichever is lower.
Sell on fall below 109 and till then use dip to 11.2 or below is to cover short position.
WEEKLY TREND INFORMATION WITH WEEKLY LEVELS
|
STRATEGY
|
CLOSE
|
DRV
|
TREND*
|
Trend
Price
|
Trend
Date
|
L1
|
L2
|
CP
|
L3
|
L4
|
|
Cover Short
|
112.40
|
116.26
|
DOWN
|
120.90
|
19.12
|
108.8
|
111.2
|
112.5
|
113.7
|
116.1
|
*Trend will remain Down as long as last close is below the pink color DRV. Trend will be Up as long as Price is above DRV. Positional Traders: If trend is up then traders long can hold long position with weekly closing stop loss of DRV: Close >DRV. If trend is down then traders can hold short position with a weekly closing stop loss of DRV: Close <DRV.
PRICE, VOLUME AND OPEN INTEREST STRATEGY
|
Last Close
|
Price G/L%
|
Volume
|
% V Inc/Dec
|
Open Interest
|
% OI Inc/Dec
|
Candle
|
Position
|
|
112.40
|
-0.09
|
19965000
|
120.97
|
1465.00
|
266.25
|
Indecisive
|
Addition long/Short
|
TECHINCAL INDICATORS TABLE
|
RSI
|
1-ROC-RSI
|
Stochastic
|
1-ROC-
Stochastic
|
MACD
|
1-ROC
MACD
|
RS
|
1-ROC
RS
|
|
39.20
|
-0.52
|
40.63
|
28.31
|
-1.82
|
-2.07
|
40.85
|
-7.26
|
Disclaimer: There is risk of loss in trading in derivatives and the report is not to be construed as investment advice. The information provided in this report is intended solely for informative purposes. The author, directors and other employees of CC Commodity Info Services cannot be held responsible for the accuracy of the information presented herein or for the results of the positions taken based on the opinions expressed above.


