Report For Week Dated:15/06/2015
NCDEX Soya Bean August (Price are in INR (Rs)/Quintal)
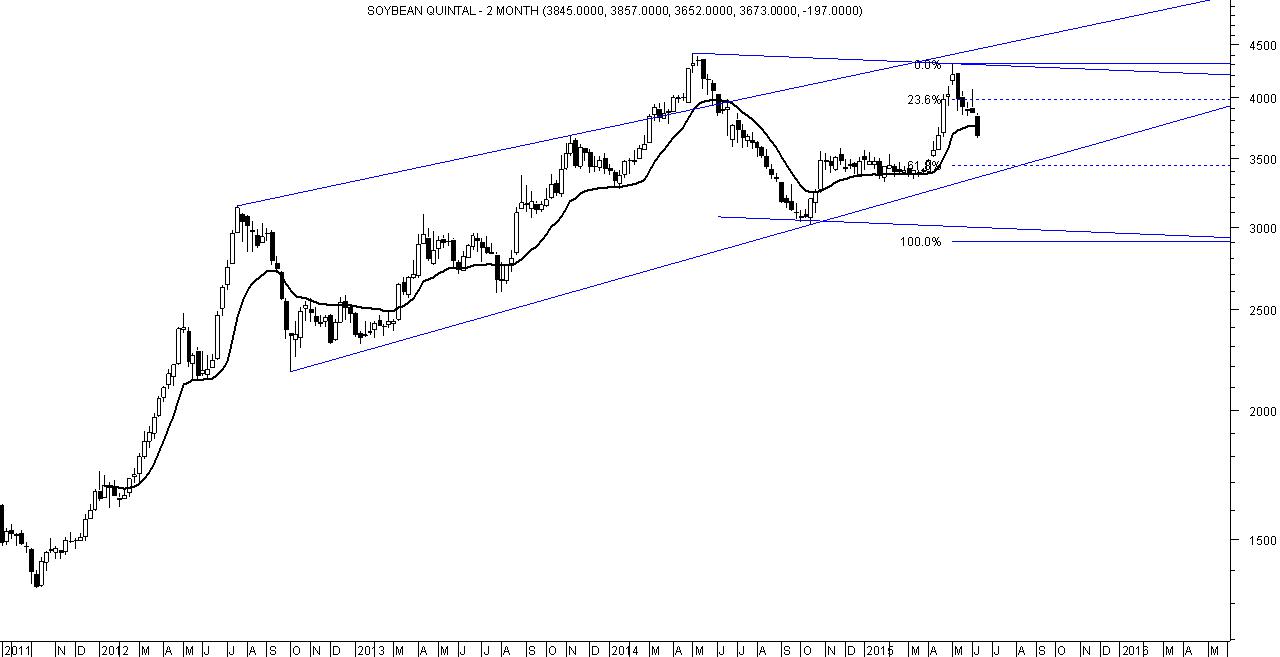
Open interest increased with the fall and negative candle which indicates addition of short position.
Indicators are falling which suggest that lower range will be tested with volatility.
Stochastic hits the oversold zone therefore intra-week recovery from lower range can be witnessed from 3598 or below levels.
The sense of the chart suggests that lower 61.8% projection target of 3463 to be tested.
Exit long and sell on rise from 3673 to 3803 with a stop loss of 3870.
Lower range for the week can be 3598-3393.
WEEKLY TREND INFORMATION WITH WEEKLY LEVELS
|
STRATEGY
|
CLOSE
|
DRV
|
TREND*
|
Trend
Price
|
Trend
Date
|
L1
|
L2
|
CP
|
L3
|
L4
|
|
Hold Short
|
3673.0
|
3756.4
|
DOWN
|
3673.0
|
12.06
|
3393
|
3598
|
3727
|
3803
|
4008
|
*Trend will remain Down as long as last close is below the pink color DRV. Trend will be Up as long as Price is above DRV. Positional Traders: If trend is up then traders long can hold long position with weekly closing stop loss of DRV: Close >DRV. If trend is down then traders can hold short position with a weekly closing stop loss of DRV: Close <DRV.
PRICE, VOLUME AND OPEN INTEREST STRATEGY
|
Last Close
|
Price G/L%
|
Volume
|
% V Inc/Dec
|
Open Interest
|
% OI Inc/Dec
|
Candle
|
Position
|
|
3673.0
|
-5.1
|
390510.0
|
58.2
|
62560
|
46.5
|
Negative
|
Addition Short
|
TECHINCAL INDICATORS TABLE
|
RSI
|
1-ROC-RSI
|
Stochastic
|
1-ROC-
Stochastic
|
MACD
|
1-ROC
MACD
|
RS
|
1-ROC
RS
|
|
50.36
|
-16.52
|
7.30
|
-66.15
|
112.69
|
-14.96
|
34.81
|
-23.19
|
Disclaimer: There is risk of loss in trading in derivatives and the report is not to be construed as investment advice. The information provided in this report is intended solely for informative purposes. The author, directors and other employees of CC Commodity Info Services cannot be held responsible for the accuracy of the information presented herein or for the results of the positions taken based on the opinions expressed above.


