Report For Week Dated: 8/06/2015
NCDEX Mustard (Price are in INR (Rs)/Quintal)
Traders long and holding the same can revise up the stop loss to 4200.
Addition of short position was seen on the weekly chart as open interest increased with the fall and bearish candle.
Intra-month correction can happen in a larger monthly up trend.
From the weekly chart perspective, traders can take profits at 4243 to 4392 as the opportunity arises.
Re-enter long on rise and close above 4392.
Expect lower range of 4186-4026 to be tested as correction can happen.
Swing top can happen if this week, we have a lower high and lower low in relation to its previous week.
Monthly Chart:
Correction during the month to 4195-4036 will be opportunity to accumulate.
The monthly chart support is in the range of 3974-3869.
Upside momentum can resume above 4392.
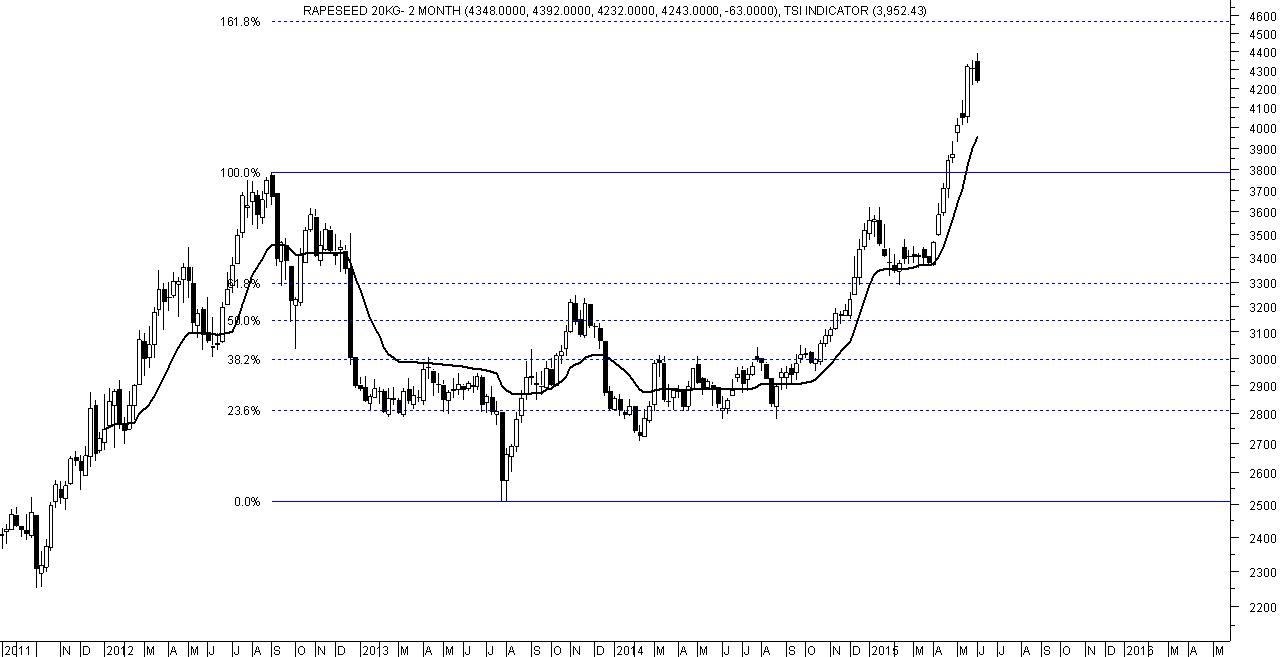
The breakout happen in April 2015 above 3782 and May 2015 was follow up.
In June 2015, intra-month correction can happen before moving back above for new higher.
The expected 161.8% retracement of the fall 3782 to 2509 during the period August 2012 to July 2014 is at 4579.
Post breakout above 3782, Mustard has already attained a high of 4392 and the same momentum can continue with volatility towards 4579 in due course of time from a perspective angle.
WEEKLY TREND INFORMATION WITH WEEKLY LEVELS
|
STRATEGY
|
CLOSE
|
DRV
|
TREND*
|
Trend
Price
|
Trend
Date
|
L1
|
L2
|
CP
|
L3
|
L4
|
|
Hold Long
|
4243.0
|
3952.4
|
UP
|
3375.0
|
13.02
|
4026
|
4186
|
4289
|
4346
|
4506
|
*Trend will remain Down as long as last close is below the pink color DRV. Trend will be Up as long as Price is above DRV. Positional Traders: If trend is up then traders long can hold long position with weekly closing stop loss of DRV: Close >DRV. If trend is down then traders can hold short position with a weekly closing stop loss of DRV: Close <DRV.
PRICE, VOLUME AND OPEN INTEREST STRATEGY
|
Last Close
|
Price G/L%
|
Volume
|
% V Inc/Dec
|
Open Interest
|
% OI Inc/Dec
|
Candle
|
Position
|
|
4243.0
|
-1.5
|
405010.0
|
46.2
|
76780
|
25.3
|
Negative
|
Addition Short
|
TECHNICAL INDICATORS TABLE
|
RSI
|
1-ROC-RSI
|
Stochastic
|
1-ROC-
Stochastic
|
MACD
|
1-ROC
MACD
|
RS
|
1-ROC
RS
|
|
82.73
|
-6.60
|
87.33
|
-4.65
|
245.98
|
4.34
|
79.15
|
1.48
|
Weekly Chart
Disclaimer: There is risk of loss in trading in derivatives and the report is not to be construed as investment advice. The information provided in this report is intended solely for informative purposes. The author, directors and other employees of CC Commodity Info Services cannot be held responsible for the accuracy of the information presented herein or for the results of the positions taken based on the opinions expressed above.


