Report For Date 18/05/2015
NCDEX Castor Seeds June (Price are in INR(Rs)/Quintal)
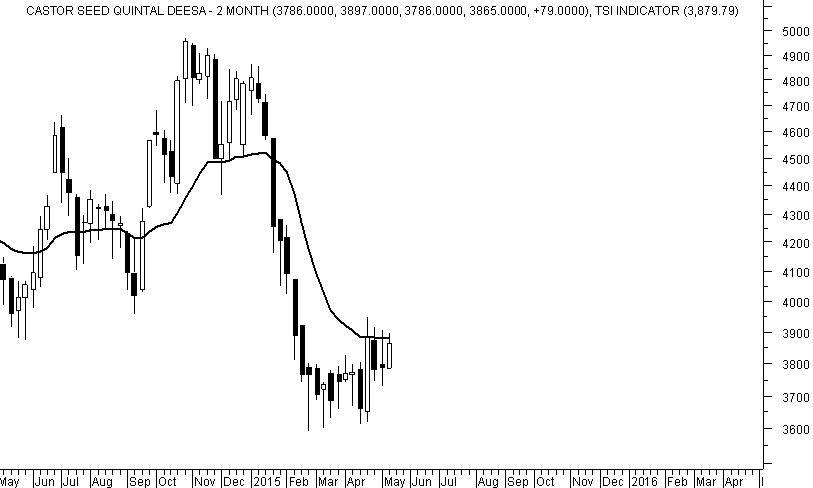
Trend on weekly chart is still down and closing is below the DRV.
The 4 weeks high is placed at 3947.
Rally can resume if weekly close is above 3937.
Last week, we saw addition of open interest along with the rise and positive candle which account for addition of long position. But the trend is down as the closing is below the DRV.
As a result of the down trend in the table, it qualifies for contrarian buying until the last week low of 3786 is not violated.
The 2 weeks low is at 3730.
The band of movement can be 3947 to 3730.
The indicators have moved up which suggest that breakout attempt could be witnessed.
Ultimately, breakout and close above 3947 is essential to see further rise.
Buy on breakout above 3937 with low of the week as the stop loss or 3865 whichever is lower.
TREND INFORMATION WITH INTRA-DAY LEVELS
|
STRATEGY
|
CLOSE
|
DRV
|
TREND*
|
Trend
Price
|
Trend
Date
|
L1
|
L2
|
CP
|
L3
|
L4
|
|
Cover Short
|
3865
|
3880
|
DOWN
|
3778
|
30.04
|
3691
|
3802
|
3849
|
3913
|
4024
|
*Trend will remain Down as long as last close is below the pink color DRV. Trend will be Up as long as Price is above DRV. Positional Traders: If trend is up then traders long can hold long position with closing stop loss of DRV: Close >DRV. If trend is down then traders can hold short position with a closing stop loss of DRV: Close <DRV.
PRICE, VOLUME AND OPEN INTEREST STRATEGY
|
Last Close
|
Price G/L%
|
Volume
|
% V Inc/Dec
|
Open Interest
|
% OI Inc/Dec
|
Candle
|
Position
|
|
3865
|
2.09
|
335210
|
13.55
|
178060
|
9.45
|
Positive
|
Addition Long
|
TECHNICAL INDICATORS TABLE
|
RSI
|
1-ROC-RSI
|
STOCHASTIC
|
1-ROC
STOCHASTIC
|
MACD
|
1-ROC
MACD
|
RS
|
1-ROC
RS
|
|
43.24
|
9.19
|
58.51
|
-3.33
|
-161.15
|
7.91
|
22.35
|
7.20
|
Note: Red Color Bar= Down Trend, Green Color Bars= Up Trend, Blue Color Bars= Sideways(Trend could be up or down), Pink Color line= DRV, V marked= Increase in Volume in relation to last few days. Trend will remain Down as long as last close is below the pink color DRV. Trend will be Up as long as Price is above DRV. Blue Color dots above the price are profit booking alerts. Purple dot on the charts are swing top/bottoms could be in place.
Disclaimer: There is risk of loss in trading in derivatives and the report is not to be construed as investment advice. The information provided in this report is intended solely for informative purposes. The author, directors and other employees of CC Commodity Info Services cannot be held responsible for the accuracy of the information presented herein or for the results of the positions taken based on the opinions expressed above.


