Report For Week Dated: 25/05/2015
MCX Crude Palm Oil (Price are in INR (Rs)/10 kg)
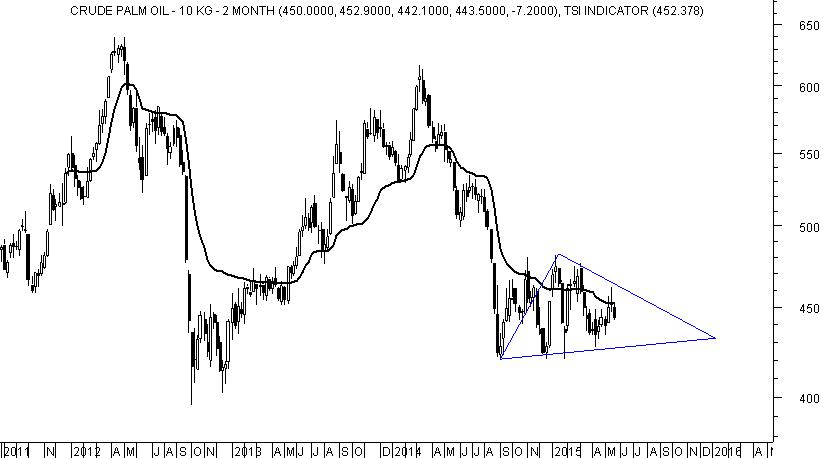
Exit long and sell on rise from 443.5-450.2 with a stop loss of 461.50.
Expect lower range of 439.4-428.6 to be tested.
Contracting movement is being witnessed.
Therefore, lower range of 439.4-428.6 can attract support for a bounce.
Indicators are falling which suggest that near term minor correction can happen with sideways volatility.
Expect lower range to be tested before moving higher.
Support cluster is at 427-420.
Breakdown will happen on fall and close below 420.
WEEKLY TREND INFORMATION WITH WEEKLY LEVELS
|
|
CLOSE
|
DRV
|
TREND*
|
Trend
Price
|
Trend
Date
|
L1
|
L2
|
CP
|
L3
|
L4
|
|
Hold Short
|
443.5
|
452.4
|
DOWN
|
459.3
|
6.03
|
428.6
|
439.4
|
446.2
|
450.2
|
461.0
|
*Trend will remain Down as long as last close is below the pink color DRV. Trend will be Up as long as Price is above DRV. Positional Traders: If trend is up then traders long can hold long position with weekly closing stop loss of DRV: Close >DRV. If trend is down then traders can hold short position with a weekly closing stop loss of DRV: Close <DRV.
PRICE, VOLUME AND OPEN INTEREST STRATEGY
|
Last Close
|
Price G/L%
|
Volume
|
% V Inc/Dec
|
Open Interest
|
% OI Inc/Dec
|
Candle
|
Position
|
|
443.5
|
-1.6
|
82390000.0
|
-4.2
|
6432.0
|
14.7
|
Negative
|
Addition Short
|
TECHNICAL INDICATORS TABLE
|
RSI
|
1-ROC-RSI
|
Stochastic
|
1-ROC-
Stochastic
|
MACD
|
1-ROC
MACD
|
RS
|
1-ROC
RS
|
|
45.90
|
-6.85
|
58.85
|
-11.01
|
-5.07
|
3.79
|
16.13
|
-20.53
|
Disclaimer: There is risk of loss in trading in derivatives and the report is not to be construed as investment advice. The information provided in this report is intended solely for informative purposes. The author, directors and other employees of CC Commodity Info Services cannot be held responsible for the accuracy of the information presented herein or for the results of the positions taken based on the opinions expressed above.


