Report For Week Dated: 27/04/2015
Zinc Weekly (Price figure in INR (Rs)/Per Kg)
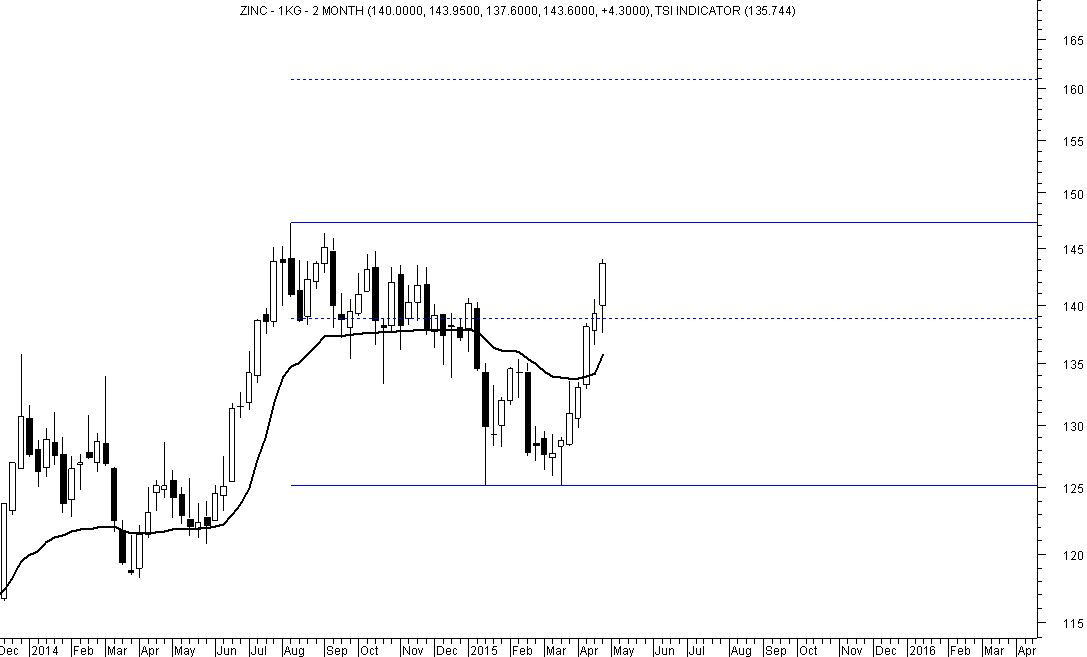
Traders long can keep the stop loss at 135.
Expect higher range of 145.8-152.2 to be tested.
On the C2 chart the peak has been 147.30 and the same is likely to be tested.
Weaker opening and correction to 141.7-139.5 can be used for buying with a stop loss of 135.
In the event of a breakout and close above 147.30, a rally to 160 can happen
WEEKLY TREND INFORMATION WITH WEEKLY LEVELS
|
STRATEGY
|
CLOSE
|
WRV
|
TREND*
|
Trend
Price
|
Trend
Date
|
L1
|
L2
|
CP
|
L3
|
L4
|
|
Hold Long
|
143.6
|
135.7
|
UP
|
138.1
|
10.04
|
133.1
|
139.5
|
141.7
|
145.8
|
152.2
|
*Trend will remain Down as long as last close is below the pink color DRV. Trend will be Up as long as Price is above DRV. Positional Traders: If trend is up then traders long can hold long position with weekly closing stop loss of DRV: Close >DRV. If trend is down then traders can hold short position with a weekly closing stop loss of DRV: Close <DRV.
PRICE, VOLUME AND OPEN INTEREST STRATEGY
|
Last Close
|
Price G/L%
|
Volume
|
% V Inc/Dec
|
Open Interest
|
% OI Inc/Dec
|
Candle
|
Position
|
|
143.6
|
3.0869
|
25865000
|
129.0965
|
2654
|
104.9421
|
Positive
|
Addition Long
|
TECHINCAL INDICATORS TABLE
|
RSI
|
1-ROC-RSI
|
Stochastic
|
1-ROC-
Stochastic
|
MACD
|
1-ROC
MACD
|
RS
|
1-ROC
RS
|
|
64.33
|
9.27
|
95.67
|
0.92
|
0.30
|
158.32
|
41.00
|
2.99
|
Disclaimer: There is risk of loss in trading in derivatives and the report is not to be construed as investment advice. The information provided in this report is intended solely for informative purposes. The author, directors and other employees of CC Commodity Info Services cannot be held responsible for the accuracy of the information presented herein or for the results of the positions taken based on the opinions expressed above.


