Report For Week Dated: 27/04/2015
MCX Copper Weekly (Price in INR(Rs)/Kg)
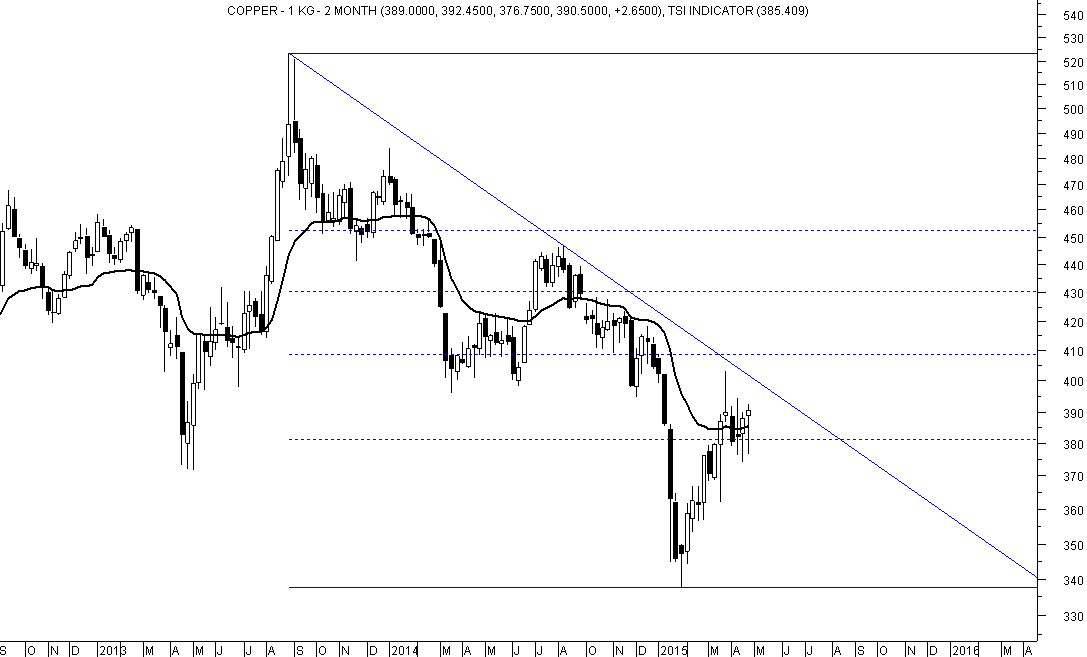
Sideways volatility around the DRV can be seen has the DRV is horizontal.
The same is depicted on the chart.
Traders by chance long and holding the same can maintain the stop loss at 373.
Resistance will be at 396-404.
A breakout and close above 404 is essential for short term rally to 430-451.
Consolidation above 373 appears to be happening unless 373 is immediately violated.
Wider band of volatility can be 362 to 404.
WEEKLY TREND INFORMATION WITH WEEKLY LEVELS
|
STRATEGY
|
CLOSE
|
DRV
|
TREND*
|
Trend
Price
|
Trend
Date
|
L1
|
L2
|
CP
|
L3
|
L4
|
|
Hold Long
|
390.50
|
385.41
|
UP
|
388
|
17.04
|
365
|
381
|
387
|
396
|
412
|
*Trend will remain Down as long as last close is below the pink color DRV. Trend will be Up as long as Price is above DRV. Positional Traders: If trend is up then traders long can hold long position with weekly closing stop loss of DRV: Close >DRV. If trend is down then traders can hold short position with a weekly closing stop loss of DRV: Close <DRV.
PRICE, VOLUME AND OPEN INTEREST STRATEGY
|
Last Close
|
Price G/L%
|
Volume
|
% V Inc/Dec
|
Open Interest
|
% OI Inc/Dec
|
Candle
|
Strategy
|
|
390.5
|
0.6833
|
12405000
|
188.6898
|
3261
|
120.7854
|
Indecisive
|
Unwinding
|
TECHNICAL INDICATORS TABLE
|
RSI
|
1-ROC-RSI
|
Stochastic
|
1-ROC-
Stochastic
|
MACD
|
1-ROC
MACD
|
RS
|
1-ROC
RS
|
|
49.81
|
8.14
|
51.89
|
-4.34
|
-6.91
|
15.45
|
33.50
|
0.06
|
Disclaimer: There is risk of loss in trading in derivatives and the report is not to be construed as investment advice. The information provided in this report is intended solely for informative purposes. The author, directors and other employees of CC Commodity Info Services cannot be held responsible for the accuracy of the information presented herein or for the results of the positions taken based on the opinions expressed above.


