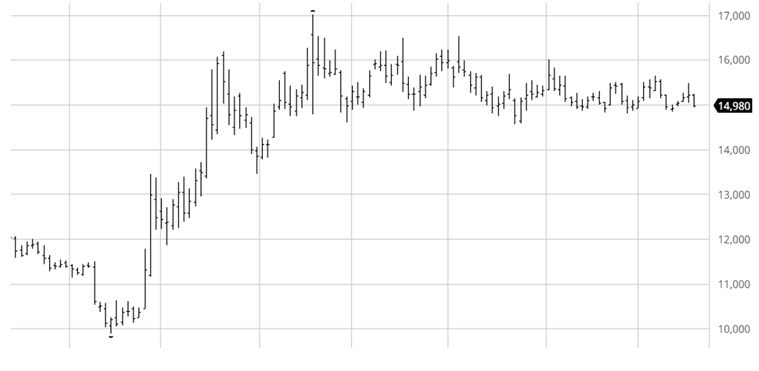
MUMBAI(Commoditiescontrol): Volatility between 15635 and 14800 has been witnessed for last 20 weeks.
Directional movement not been witnessed as yet to benefit by holding long/short position in CZCE Cotton May 2018. The same can been seen from 3 year chart and 13 year chart inserted below.
Bearish candle has been formed along with addition of short position on the weekly candle.
Resistance will be at 15048-15167.
Lower range is at 14862-14800.
Exit long position on better opening to resistance or initial rise to resistance levels.
Lower levels of 14840-14800-14605 can create recovery or for bounce.
Ideally, avoid trading from position point of view as opposite movement are happening almost every alternate week or in couple of weeks.
Long term Chart Snap Shot
The second chart is the 3 year chart snap shot which shows prolonged sideways contracting movement
The third chart is since year 2006.
The weekly for last 6 month and 3 years show a contracting movement and showing a descending triangle.
Expect lower range of 14850-14605 can be tested considering bearish candle last week.
Overall till the 2 weeks high is not crossed which is at 15485 upside cannot resume.
Breakout and close above 15485 can lead to a massive rally.
The chart since the year 2006 show that a breakout can lead levels of 20000.
Once then breakout is witnessed traders can focus of higher level and till then the bias is to test 14605 and exit long position on the rise.
Weekly resistance will be at 15048-15167 and can be used to sell as addition of short position has been witnessed with a stop loss of 15485.
Overall trade long whenever breakout and close above 15485 is witnessed.
Support of 14850-14605 is critical.
A fall and close below 14600 can extend the slide to 14045-13450.
TREND INFORMATION WITH INTRA-DAY LEVELS
|
STRATEGY
|
CLOSE
|
DRV
|
TREND*
|
Trend
Price
|
Trend
Date
|
L1
|
L2
|
CP
|
L3
|
L4
|
|
-
|
14980.0
|
15055.1
|
DOWN
|
14980.0
|
16.03
|
14557
|
14862
|
15048
|
15167
|
15472
|
*Trend will remain Down as long as last close is below the pink color DRV. Trend will be Up as long as Price is above DRV. Positional Traders: If trend is up then traders long can hold long position with closing stop loss of DRV: Close >DRV. If trend is down then traders can hold short position with a closing stop loss of DRV: Close <DRV.
PRICE, VOLUME AND OPEN INTEREST STRATEGY
|
LAST CLOSE
|
PRICE G/L%
|
VOLUME
|
% V INC/DEC
|
OPEN INTEREST
|
% OI INC/DEC
|
CANDLE
|
POSITION
|
|
14980.0
|
-1.5
|
554398
|
-58.7
|
222460
|
69.3
|
Negative
|
Addition Short
|
TECHNICAL INDICATORS TABLE
|
RSI
|
1-ROC-RSI
|
Stochastic
|
1-ROC-
Stochastic
|
MACD
|
1-ROC
MACD
|
RS
|
1-ROC
RS
|
|
43.20
|
-10.51
|
41.94
|
-0.23
|
-56.93
|
-20.25
|
40.56
|
-11.81
|
.jpg)
.png)
Disclaimer: There is risk of loss in trading in derivatives and the report is not to be construed as investment advice. The information provided in this report is intended solely for informative purposes. The author, directors and other employees of CC Commodity Info Services cannot be held responsible for the accuracy of the information presented herein or for the results of the positions taken based on the opinions expressed above.


