REPORT For Date 09/04/2018
NY COT EXCHANGE Cotton No.2 (Price figures in cent/5000lbs):
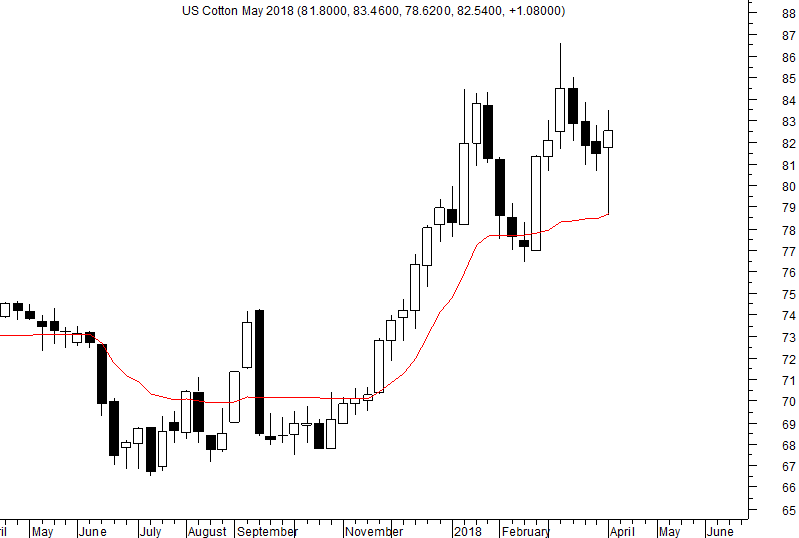
The low registered last week was 78.62.
Cotton prices tested the DRV which was at 78.47 last week.
Recovery has been witnessed to close the week at 82.54.
Last week we had indicated that correction to DRV-78.47 or below can be used for accumulation with a stop loss of 76.50.
The low was almost at the DRV.
Traders who were able to implement had the opportunity to benefit.
On the weekly chart as a result of the recovery, we have a large lower shadow which suggests support at lower level but minor correction on volatility may happen to test the lower support level.
Lower range for the week can be 81.54-79.62.
Higher range for the week can be 84.46-89.30.
The peak registered a few weeks back was 86.60 therefore breakout above 86.60 is essential at the end of the week to show a rally.
Accumulate at 81.54-79.62 with a stop loss of 76.44.
A consolidation process could be happening at lower level as long as the low of 76.44 is not violated.
TREND INFORMATION WITH INTRA-DAY LEVELS
|
STRATEGY
|
CLOSE
|
DRV
|
TREND*
|
Trend
Price
|
Trend
Date
|
L1
|
L2
|
CP
|
L3
|
L4
|
|
-
|
82.54
|
78.69
|
UP
|
81.34
|
23.02
|
74.78
|
79.62
|
81.54
|
84.46
|
89.30
|
*Trend will remain Down as long as last close is below the pink color DRV. Trend will be Up as long as Price is above DRV. Positional Traders: If trend is up then traders long can hold long position with closing stop loss of DRV: Close >DRV. If trend is down then traders can hold short position with a closing stop loss of DRV: Close <DRV.
PRICE, VOLUME AND OPEN INTEREST STRATEGY
|
Close
|
PRICE G/L%
|
VOLUME
|
% V INC/DEC
|
OPEN INTEREST
|
% OI INC/DEC
|
CANDLE
|
POSITION
|
|
82.5
|
1.3
|
142469
|
127.9
|
-
|
-
|
Indecisive
|
-
|
TECHNICAL INDICATORS TABLE
|
RSI
|
1-ROC-RSI
|
Stochastic
|
1-ROC-
Stochastic
|
MACD
|
1-ROC
MACD
|
RS
|
1-ROC
RS
|
|
59.69
|
-1.77
|
46.91
|
-27.41
|
2.60
|
-4.41
|
59.12
|
-9.83
|
Disclaimer: There is risk of loss in trading in derivatives and the report is not to be construed as investment advice. The information provided in this report is intended solely for informative purposes. The author, directors and other employees of CC Commodity Info Services cannot be held responsible for the accuracy of the information presented herein or for the results of the positions taken based on the opinions expressed above.


