Report For Date: 18/03/2019
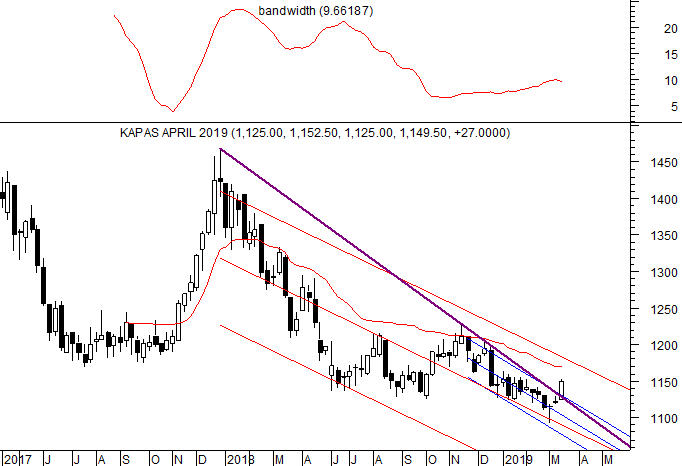
NCDEX Kapas April 2018 in Rs/20Kg
Cover short position at 1149 or below.
Open Interest increased with the rise and positive candle which indicates addition of long position.
Trend is down as price closing is below WRV.
Standard Error Channel breakout of the falling leg from 1228 to 1093 has been witnessed with bullish candle.
Expect the upper channel line of Standard Error Channel of the larger falling leg from 1468 to 1093. Support has been witnessed on the median line of the same falling leg at the low of 1093.
Contrarian accumulation can be undertaken at 1149 and on decline to support of 1142-1132 with a stop loss of 1115.
Expect a rise towards WRV-1168 and towards the upper channel line which is around 1175.
Higher range for the week is 1160-1187.
TREND INFORMATION WITH WEEKLY LEVELS
|
CLOSE
|
WRV
|
TREND*
|
Trend
Price
|
Trend
Date
|
L1
|
L2
|
CP
|
L3
|
L4
|
|
1149.50
|
1168.97
|
DOWN
|
1298.6
|
16.02
|
1105
|
1132
|
1142
|
1160
|
1187
|
*Trend will remain Down as long as last close is below the pink color WRV. Trend will be Up as long as Price is above WRV (Weekly Reversal Value). Positional Traders: If trend is up then traders long can hold long position with closing stop loss of WRV: Close >WRV=Up Trend. If trend is down then traders can hold short position with a closing stop loss of WRV: Close <WRV=Down Trend.
PRICE, VOLUME AND OPEN INTEREST STRATEGY
|
Last Close
|
Price G/L%
|
Volume
|
% V Inc/Dec
|
Open Interest
|
% OI Inc/Dec
|
Candle
|
Position
|
|
1149.5
|
2.4
|
16404.0
|
103.8
|
12037.0
|
1.0
|
Positive
|
Addition Long
|
TECHNICAL INDICATORS TABLE
|
RSI
|
1-ROC-RSI
|
STOCHASTIC
|
1-ROC-
STOCHASTIC
|
MACD
|
1-ROC
MACD
|
RS
|
1-ROC
RS
|
|
48.28
|
18.94
|
64.20
|
76.13
|
-15.58
|
12.78
|
56.87
|
57.14
|
 Disclaimer: There is risk of loss in trading in derivatives and the report is not to be construed as investment advice. The information provided in this report is intended solely for informative purposes. The author, directors and other employees of CC Commodity Info Services cannot be held responsible for the accuracy of the information presented herein or for the results of the positions taken based on the opinions expressed above.


