Report For Date: 20/08/2018
NCDEX COC :( Price in Rs/Quintal)
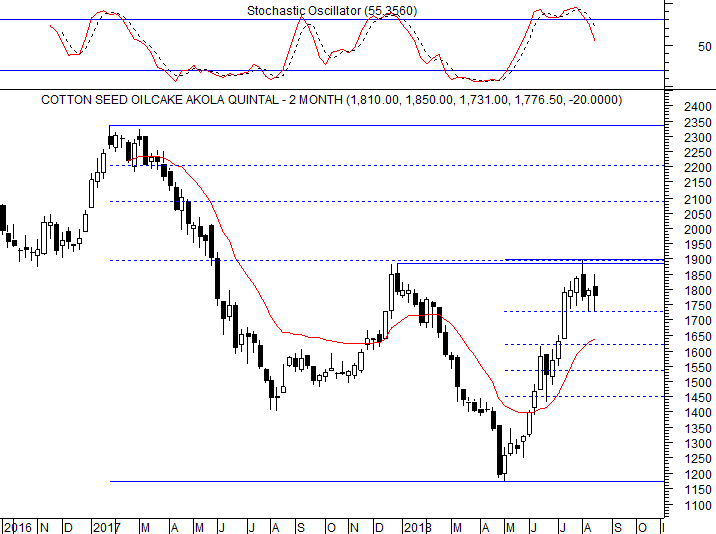
Traders long and holding the same can maintain the stop loss at 1728.
Resistance is at 1841-1898.
Further rally is above 1898.
Traders long and holding the same can maintain the stop loss as indicated above and take trading or profits at 1841-1898 range.
The 61.8% retracement of the fall from 2338 to 1171 is at 1885 and the prices have got stuck under 1885.
The high registered against 1885 is 1898 and has not crossed the same for last few weeks.
Correction will be seen below 1728.
Correction in that case can get down to DRV-1628.
Higher range till 1898 is not crossed can be used to exit long and take profits.
In the event of a breakout and close above 1898 with bullish candle expect a rally to 2095.
A fall and close below 1728 with bearish candle can set a correction to 1627 which is 38.2% retracement of the fall rise from 1171 to 1898.
TREND INFORMATION WITH WEEKLY LEVELS
|
CLOSE
|
DRV
|
TREND*
|
Trend
Price
|
Trend
Date
|
L1
|
L2
|
CP
|
L3
|
L4
|
|
1776.50
|
1639.31
|
UP
|
1468.00
|
8.06
|
1603
|
1722
|
1786
|
1841
|
1960
|
*Trend will remain Down as long as last close is below the pink color DRV. Trend will be Up as long as Price is above DRV. Positional Traders: If trend is up then traders long can hold long position with closing stop loss of DRV: Close >DRV. If trend is down then traders can hold short position with a closing stop loss of DRV: Close <DRV.
PRICE, VOLUME AND OPEN INTEREST STRATEGY
|
LAST CLOSE
|
PRICE G/L%
|
VOLUME
|
% V INC/DEC
|
OPEN INTEREST
|
% OI INC/DEC
|
CANDLE
|
POSITION
|
|
1776.50
|
-1.1
|
241310.0
|
-19.4
|
125260.0
|
-4.5
|
Indecisive
|
Unwinding
|
TECHNICAL INDICATORS TABLE
|
RSI
|
1-ROC-RSI
|
STOCHASTIC
|
1-ROC
STOCHASTIC
|
MACD
|
1-ROC
MACD
|
RS
|
1-ROC
RS
|
|
62.49
|
-2.71
|
55.36
|
-27.02
|
68.05
|
6.49
|
56.88
|
-4.96
|
Disclaimer: There is risk of loss in trading in derivatives and the report is not to be construed as investment advice. The information provided in this report is intended solely for informative purposes. The author, directors and other employees of CC Commodity Info Services cannot be held responsible for the accuracy of the information presented herein or for the results of the positions taken based on the opinions expressed above.


