Report For Date: 19/03/2018
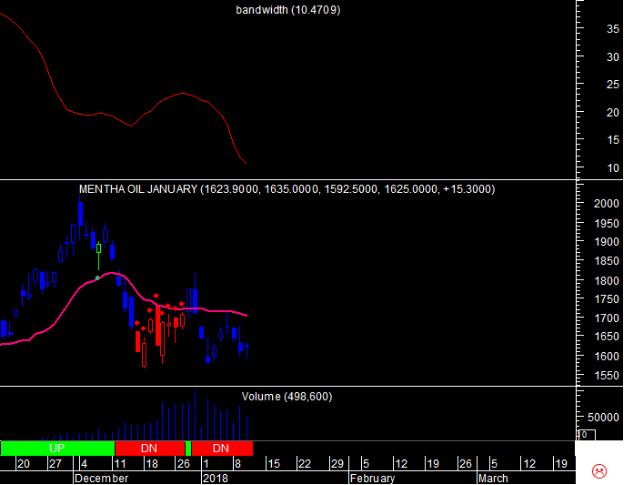
MCX Mentha Oil April: Further Weakness Is Below 1146 Closing
MCX Mentha Oil (Price are in INR )
Cover short position has doji has been witnessed which suggest that momentary pause to the
fall is likely unless a lower high and lower low is witnessed in relation to its previous week.
A higher low and higher high in the upcoming week can mark a swing bottom if the candle is also bullish.
Traders short need to maintain the stop loss at 1237 and look to cover short position.
Sell is below 1146 and cover short position till 1146 is not violated.
|
STRATEGY
|
CLOSE
|
DRV
|
TREND*
|
Trend
Price
|
Trend
Date
|
L1
|
L2
|
CP
|
L3
|
L4
|
|
-
|
1206.70
|
1405.79
|
DOWN
|
1436.5
|
9.02
|
1066
|
1157
|
1197
|
1247
|
1337
|
*Trend will remain Down as long as last close is below the pink color DRV. Trend will be Up as long as Price is above DRV. Positional Traders: If trend is up then traders long can hold long position with closing stop loss of DRV: Close >DRV. If trend is down then traders can hold short position with a closing stop loss of DRV: Close <DRV.
PRICE, VOLUME AND OPEN INTEREST STRATEGY
|
LAST CLOSE
|
PRICE G/L%
|
VOLUME
|
V -G/L%
|
OPEN INTEREST
|
OI -G/L %
|
CANDLE
|
POSITION
|
|
1206.7
|
-0.7
|
2615400
|
-11.5
|
996
|
-6.6
|
Indecisive
|
Unwinding
|
TECHNICAL INDICATORS TABLE
|
RSI
|
1-ROC-RSI
|
STOCHASTIC
|
1-ROC
STOCHASTIC
|
MACD
|
1-ROC
MACD
|
RS
|
1-ROC
RS
|
|
40.11
|
-4.05
|
7.36
|
-30.37
|
23.77
|
-48.67
|
24.65
|
-6.41
|
.png)
.png)
Note: Red Color Bar= Down Trend, Green Color Bars= Up Trend, Blue Color Bars= Sideways(Trend could be up or down), Pink Color line= DRV, V marked= Increase in Volume in relation to last few days. Trend will remain Down as long as last close is below the pink color DRV. Trend will be Up as long as Price is above DRV. Blue Color dots above the price are profit booking alerts. Purple dot on the charts are swing top/bottoms could be in place.
Disclaimer: There is risk of loss in trading in derivatives and the report is not to be construed as investment advice. The information provided in this report is intended solely for informative purposes. The author, directors and other employees of CC Commodity Info Services cannot be held responsible for the accuracy of the information presented herein or for the results of the positions taken based on the opinions expressed above.


