Report for Date: 14/08/2017
MCX Aluminum (Price figures below are in Rs/INR per Kg)
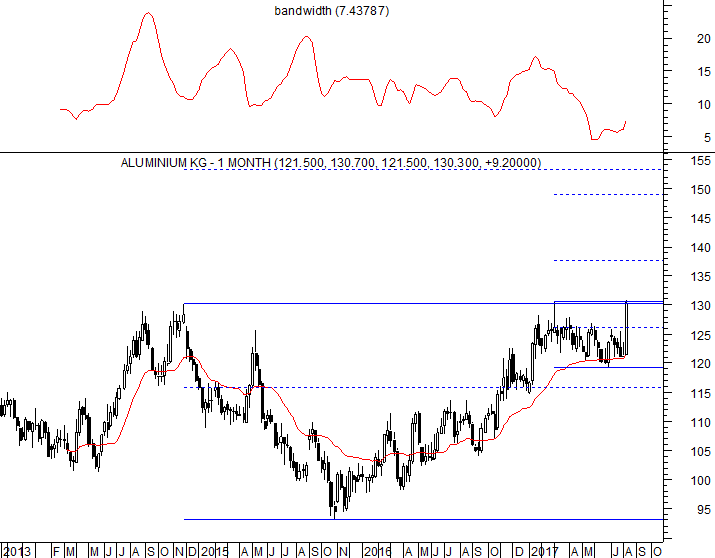
Accumulate at correction first to 127.5-124.3 with a stop loss of 121.50.
Expect 133.5-142.70 to be tested.
On further sustained rise and close above 133.5 expect a rally to 153.
Intermediate levels can be at 137.5 and 148.50.
Historically it has been observed that higher range of 133-151.50 is not sustainable therefore traders can take profits at higher levels.
TREND INFORMATION WITH WEEKLY LEVELS
|
STRATEGY
|
CLOSE
|
DRV
|
TREND*
|
Trend
Price
|
Trend
Date
|
L1
|
L2
|
CP
|
L3
|
L4
|
|
Hold Long
|
130.3
|
121.5
|
UP
|
124
|
30.06
|
115.1
|
124.3
|
127.5
|
133.5
|
142.7
|
*Trend will remain Down as long as last close is below the pink color DRV. Trend will be Up as long as Price is above DRV.
PRICE, VOLUME AND OPEN INTEREST STRATEGY
|
Last Close
|
Price G/L%
|
Volume
|
V -G/L%
|
Open Interest
|
OI -G/L %
|
Candle
|
Position
|
|
130.3
|
7.6
|
314064992
|
137.4
|
4520
|
16.6
|
Positive
|
Addition Long
|
TECHINCAL INDICATORS TABLE
|
RSI
|
1-ROC-RSI
|
Stochastic
|
1-ROC-
Stochastic
|
MACD
|
1-ROC
MACD
|
RS
|
1-ROC
RS
|
|
64.94
|
36.93
|
54.23
|
81.76
|
0.90
|
165.95
|
62.26
|
73.15
|
Disclaimer: There is risk of loss in trading in derivatives and the report is not to be construed as investment advice. The information provided in this report is intended solely for informative purposes. The author, directors and other employees of CC Commodity Info Services cannot be held responsible for the accuracy of the information presented herein or for the results of the positions taken based on the opinions expressed above.


