Report for Date: 05/12/2016
MCX Aluminum December Weekly: Exit Long On The Rise
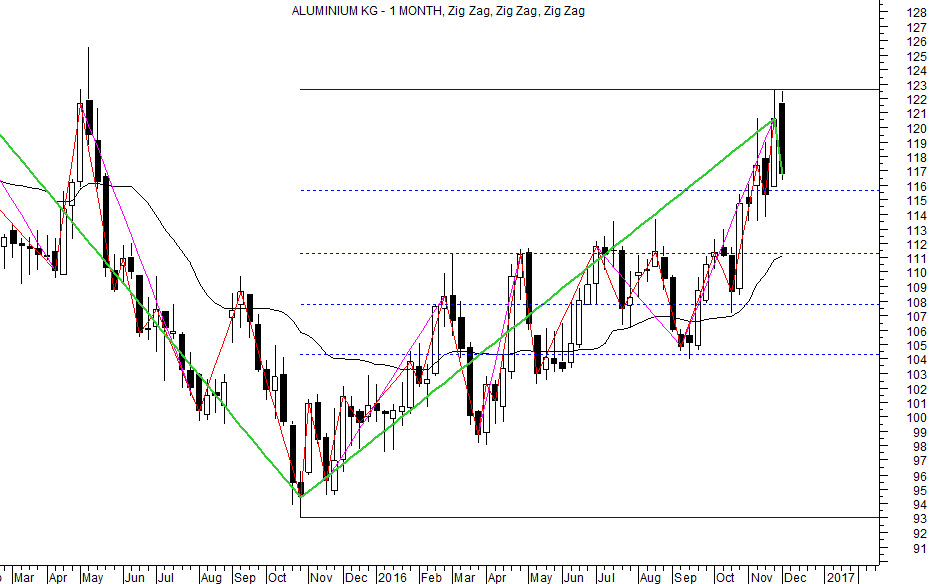
MCX Aluminum (Price figures below are in Rs/INR per Kg)
Traders long and holding the same can maintain the stop loss at 113.
Dark Cloud Cover candlestick pattern has been formed which has bearish implication or indicates that near term top is in place.
Addition of short position has been witnessed as open interest increased with the fall and bearish candle.
Exit long on rise to 118.6 or above as the opportunity arises.
Expect lower range of 114.6-108.5 to be tested.
TREND INFORMATION WITH WEEKLY LEVELS
|
STRATEGY
|
CLOSE
|
DRV
|
TREND*
|
Trend
Price
|
Trend
Date
|
L1
|
L2
|
CP
|
L3
|
L4
|
|
Hold Long
|
116.9
|
111.18
|
UP
|
108.70
|
23.09
|
108.5
|
114.6
|
118.6
|
120.8
|
126.9
|
*Trend will remain Down as long as last close is below the pink color DRV. Trend will be Up as long as Price is above DRV.
PRICE, VOLUME AND OPEN INTEREST STRATEGY
|
Last Close
|
Price G/L%
|
Volume
|
V -G/L%
|
Open Interest
|
OI -G/L %
|
Candle
|
Position
|
|
116.9
|
-3.1
|
126520000
|
-22.8
|
3378
|
46.4
|
Negative
|
Addition Short
|
TECHINCAL INDICATORS TABLE
|
RSI
|
1-ROC-RSI
|
Stochastic
|
1-ROC-
Stochastic
|
MACD
|
1-ROC
MACD
|
RS
|
1-ROC
RS
|
|
59.65
|
-11.60
|
64.40
|
-13.18
|
2.69
|
2.28
|
52.01
|
-17.91
|

Disclaimer: There is risk of loss in trading in derivatives and the report is not to be construed as investment advice. The information provided in this report is intended solely for informative purposes. The author, directors and other employees of CC Commodity Info Services cannot be held responsible for the accuracy of the information presented herein or for the results of the positions taken based on the opinions expressed above.


